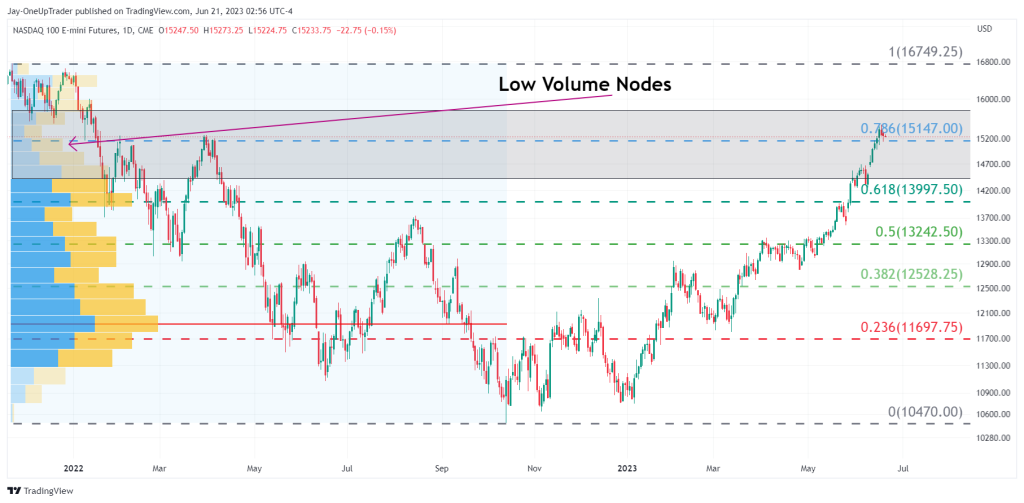
- Technical Recap: Nasdaq (NQ) has hit the 78% Fib level at $15,147, rallying 8% since June 9th.
- Bullish Targets: The absence of bearish signals and the RSI’s continuous upward trend suggest further upside potential.
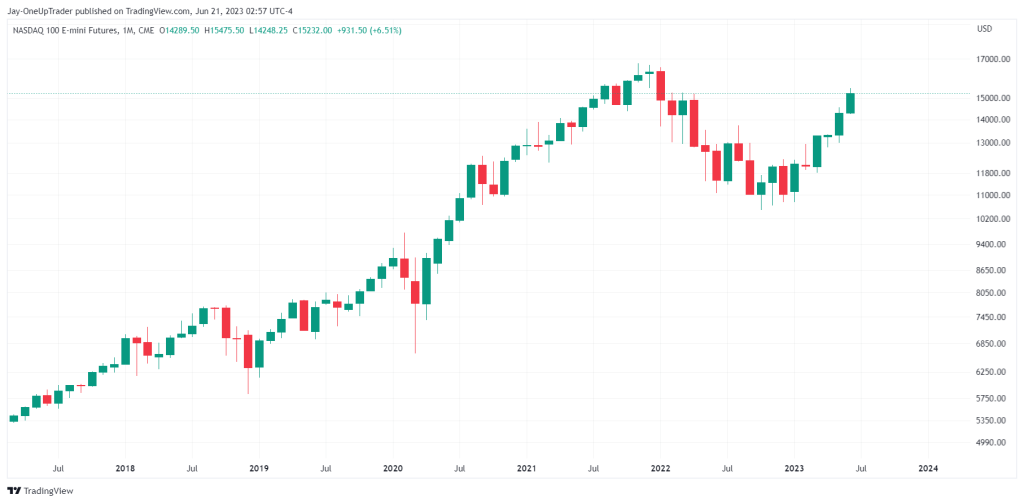
- Monthly Chart Analysis: The monthly chart highlights the highly bullish price action on NQ.
Technical Recap
The last time we did technicals on NQ was June 9th. Bulls looked steadfast on hitting the 78% Fib level at $15,147, which has officially happened. The Nasdaq rallied 8% since June 9th, and doesn’t look like it’s slowing any time soon.
Targets
From here, there is very little evidence for a bearish reversal. The RSI continues to print higher highs with no divergence in sight, and the bull trend is very strong. We can look at targets now being an all-time high at $16,767. Just like I mentioned last week, NQ has surged through the low-volume nodes on the volume profile indicator. Read more.
Monthly Chart
The monthly chart shows how bullish the price action is on NQ. The retracement is over, and it looks likely that it is just a matter of time before we have new highs on the tech-heavy index.