- NQ chart shows a vertical rally, despite high-interest rates as Apple hits all time highs.
- Caution advised for long positions with high RSI overbought on the weekly chart.
- Avoid chasing candles as bulls may take profit.
- NQ is 14% off the all-time highs.
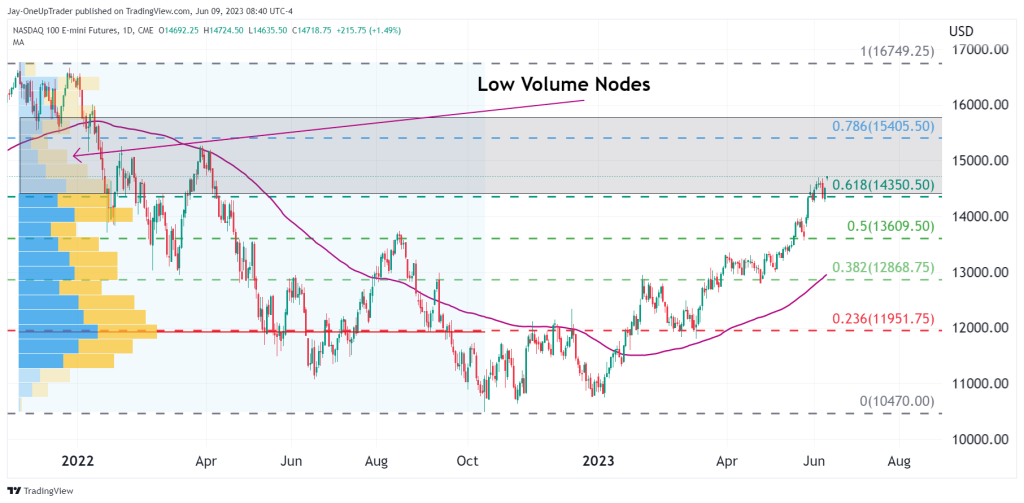
- Price aiming for $15,405 as the 78% Fibonacci retracement level.
- Market cleared into a low volume node, indicating potential fast movement.
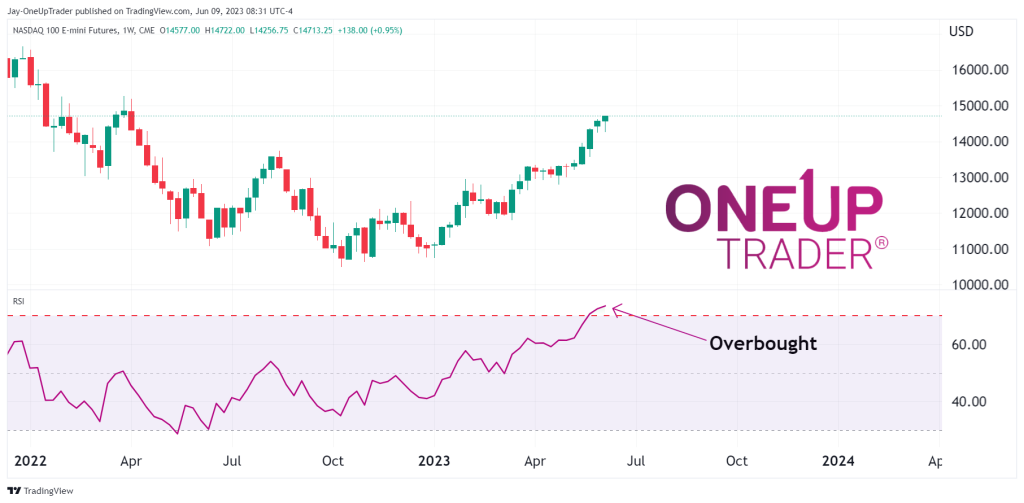
Price action
If we look at the weekly time frame, the chart almost looks vertical. NQ has rallied hard, with big tech stocks like Apple hitting new all-time highs. It shows you that even in an environment of high-interest rates, the market can still do strange things. Sticking to technicals is the way forward.
Weekly RSI is overbought. We should consider avoiding taking longs with the RSI so overbought, especially when it’s on the weekly time frame. The bulls will eventually want to take profit, so don’t get caught chasing candles. NQ is only 14% off the all-time-highs.
Daily Chart
NQ looks set on targeting the 78% Fib retracement level. This is at a price of $15,405. Price has also cleared into a low volume node which, as I have mentioned previously, markets move quickly through low vol nodes because of less liquidity than normal. There is no case for the bears at the moment but bulls should still be very careful of chasing the market higher because it does appear overbought.