


Introduction
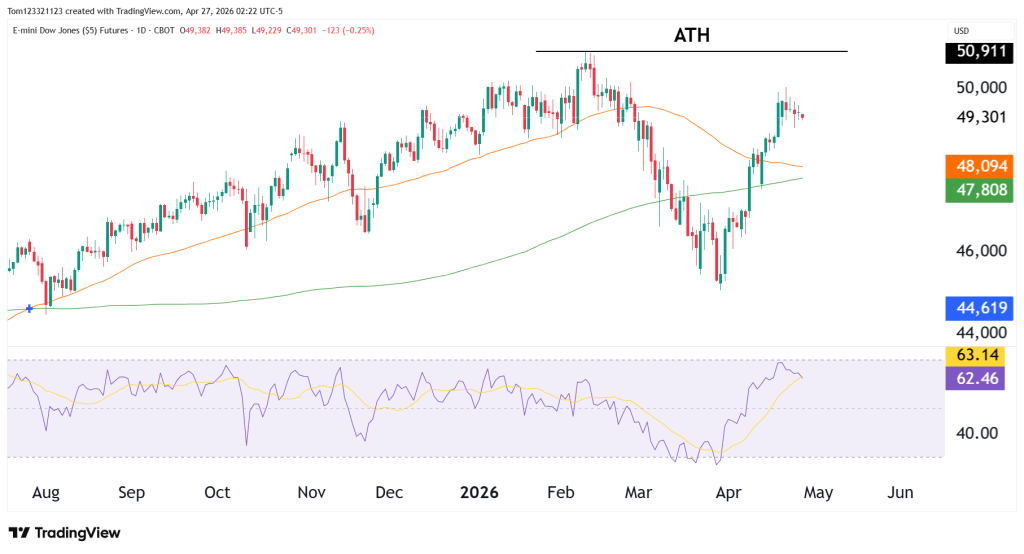
The Dow has made a solid recovery from the April lows and is now trading back near the upper end of its range. The move higher has been clean and steady, and has followed the other US equity markets. YM is lagging slightly, though, and has not breached the ATH like the S&P 500.
With inflation data coming out later this week and Non-farm payrolls on the 1st of May, we could see a shift in the direction of the market and an increase in the volatility. What is important, though, is more the rhetoric from Donald Trump and the conflicts in the Middle East.
With that said, let’s take a closer look at the technicals.
Technical Analysis
The rally off the lows had good momentum. Price reclaimed both the 50-day and 200-day moving averages and moved higher without much hesitation. If price remained lower for longer, it would have likely led to a death cross in the moving averages. Now, bulls are in firm control again and longs appear to be a better play than shorts.
Price is pushing into the 49,500–50,000 area, but instead of continuing higher, it’s beginning to stall. The candles are smaller, and the follow-through is not as strong as it was earlier in the move. The rally was strong, however, so some profit-taking is warranted here.
The important levels are:
- Resistance: 49,500–50,000, then 50,900 (ATH)
- Support: 48,000–48,200, then 47,500
If price can move above 50,000 and hold, it opens the path toward the highs. The market is awaiting the FOMC coming on Friday and inflation data. This is going to affect the value of the Dollar and will be the biggest driver of the dow jones.
Scenarios and Probabilities
| Scenario | Description | Estiamted Probability |
|---|---|---|
| Consolidation | Range between ~48,000 and ~50,000 | 45% |
| Continuation | Break above 50,000 → move toward ATH | 35% |
| Pullback | Rejection → move back toward 48,000 | 20% |
Right now, the most likely outcome is some form of consolidation. The market has already moved a lot and may need time before the next push.
Possible Trades
Longs still make sense, but they are cleaner on pullbacks rather than at current levels.
A move back into the 48,000 area, followed by a strong reaction, would be a better place to look for entries.
This analysis is for educational and informational purposes only and does not constitute trading advice. Futures and forex trading involve significant risk and may not be suitable for all investors. Always conduct your own research before making trading decisions.
