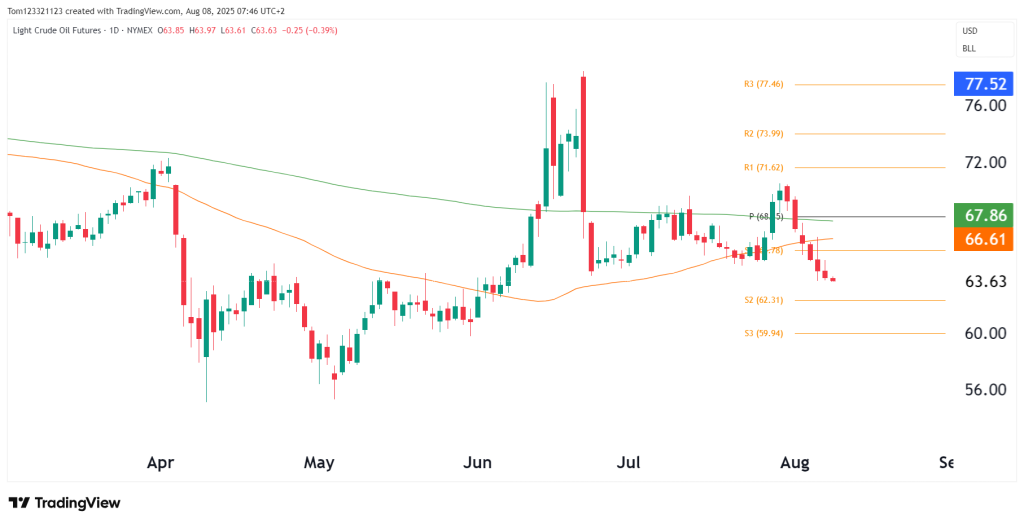
Crude oil continues to sell off after last week’s sharp rejection from the 200-day moving average ($67.86) and key pivot level ($68.50).
Price is now trading below both the 50-day and 200-day MAs, which flips the medium-term structure to bearish.
The breakdown below $66.60 confirms a short-term trend reversal after multiple failed attempts to establish a higher low.
There’s no clear support until the $62.30 S2 level, and beyond that, the next major test is $59.90 (S3) — a level not seen since early June.
Momentum & Volatility
Multiple consecutive red candles with narrow real bodies point to controlled selling pressure, not panic.
The failure to sustain any bullish impulse near resistance shows lack of dip-buying interest, at least for now.
Key Technical Levels
Level
Type
Description
68.50
Pivot (P)
Prior rejection level, key resistance
66.61
50DMA
Broken support turned resistance
62.31
S2
First strong support test
59.94
S3
Critical downside level
71.62
R1
Bullish breakout reclaim level
Probability Table
Scenario
Estimated Probability
Commentary
Continuation lower to test $62.30–$60.00
55%
Bearish structure, below key MAs, no support until S2
Minor bounce to retest 50MA (~$66.60)
30%
Could occur if $63.00 base holds intraday
Sharp reversal and reclaim of $68.50 (pivot)
15%
Needs a surprise geopolitical or supply-driven event
Trade Setups
Bearish Setup
Entry: On breakdown below $63.50
Target: $62.30 (S2), extend to $60.00 (S3)
Stop: Above $66.00 (back inside broken support)
Bullish Reversal Setup
Entry: Reclaim of $66.60 and daily close above
Target: $68.50 pivot, stretch target $71.60 (R1)
Stop: Below $64.00
Macro & Cross-Asset Context
Geopolitics: Despite ongoing tensions in the Middle East, oil is not reacting as bullishly as expected, suggesting demand concerns are outweighing supply fears.
USD Strength: A rebound in the U.S. Dollar Index (DXY) is pressuring oil by making it more expensive for non-dollar buyers.
Equity Weakness: Broader U.S. equity hesitation is adding to oil’s bearish tone, with risk-off sentiment curbing commodity appetite.
Final Takeaway
CL is vulnerable to deeper downside with sellers in control. A failure to hold above $63 could expose the market to a drop toward $60. Bulls need to step in soon — otherwise, this breakdown could develop into a broader trend reversal.
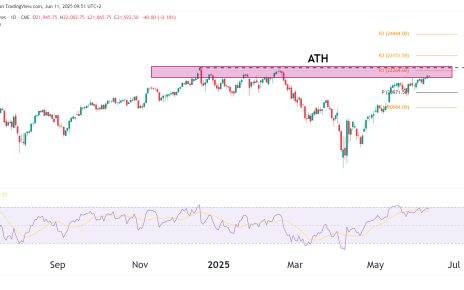
Technical Overview Resistance Zone & ATH Key Pivot Levels Pivot Zone Price ATH / R1 22,425.75 R2 23,151.50 R3 24,444.00 Pivot (neutral) 20,971.50 S1 (support) 20,084.00 It looks like its just a matter of time before the price breaks above the high but nothing is certain in markets so we have to wait and see. Read More…
Bullish momentum NQ has rallied 47% since the low made in October of last year, and the bullish momentum shows no signs of slowing down. I see no bearish case for Nasdaq at this point. Let’s take a look at the technicals and if we see NQ reaching all-time highs in the next few weeks Read More…
The first target of $1,780 is very close to being hit as Gold rallies. Potential catalysts that could send the price lower. Quick Recap On Last Week’s Gold Analysis The bounce off the 100 EMA, Point of control, and 0.236 Fibonacci retracement level has already resulted in Gold gaining about 25 points since we did Read More…


