- Analyzing the different entry zone spoke of last week and if they are still available.
- Looking at the erratic price action of RTY and why.
RTY retraces into buy zone
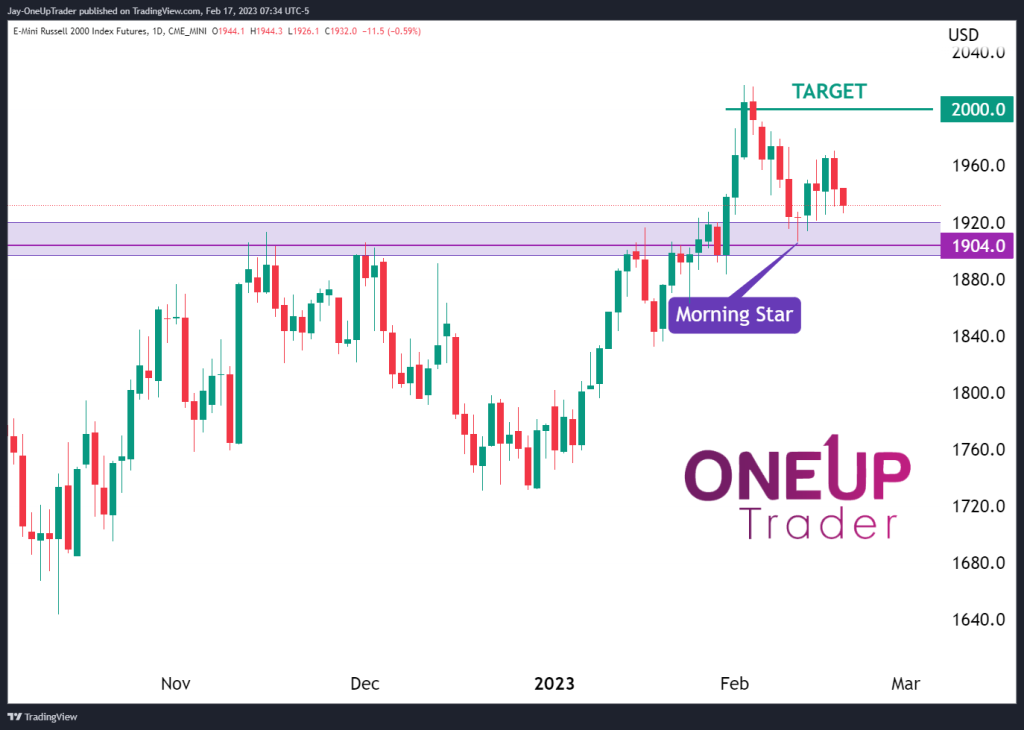
Last week, I mentioned two zones where we could look at initiating long positions. At the time of writing that article, RTY was trading at $1,957. The first buy zone was set at $1,945, and the second was at $1,904. Russell futures have retraced into the second buy zone and have bounced immediately, forming a morning star pattern on the daily chart. After a small initial rally after the evening star, price has pulled back, offering one more chance for bulls to enter. Take a look at the analysis here before we move on to possible entry strategies.
Entries
If traders agree with the bullish sentiment, longs can be taken at current prices, with stops being placed at a minimum below $1,904, though it’s probably better to set them lower than that. Targets can be set around the most recent high ($2,000).
The trade itself is not one we could write home about, but there is a 2:1 risk-reward ratio and a support zone at $1,920 that we are relying on to give the necessary support for a small move higher.
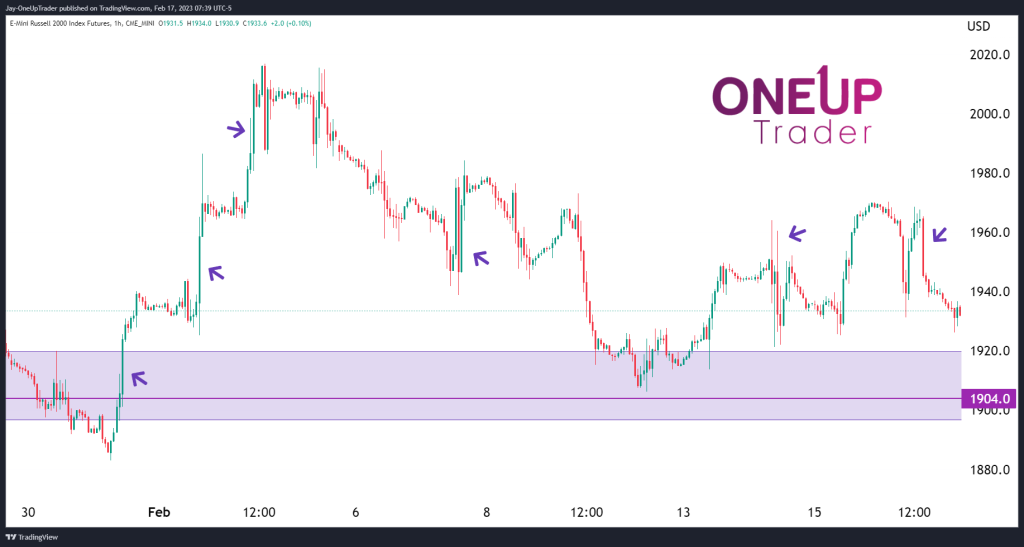
The erratic price action of the RTY contract
I want to take a look at the erratic price action of the RTY and give my opinion as to why I feel it’s not a market we should be trading on a short time frame. Price has extremely volatile periods where we often see a big spike in one direction that involves a large candlestick followed by small candles that have tiny ranges.
This can make it very difficult to form a consistent strategy in the long term, so I suggest anyone trading the RTY take a look at charts above the 4 Hourly for analysis and entries. Wide stops are required in this environment, too or else positions will get whipsawed due to the volatility.
I marked all the candles as examples in the chart below.