

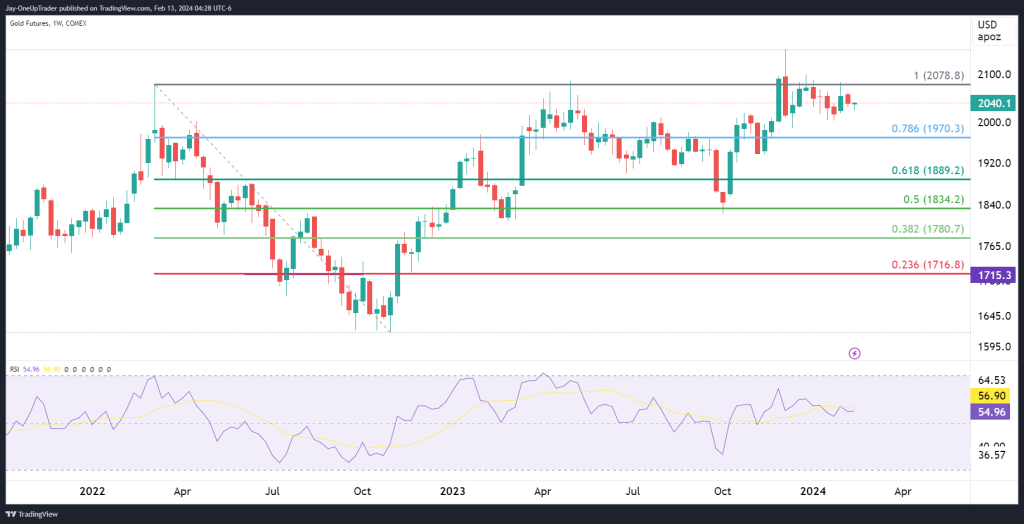
Weekly Chart Analysis of Gold Futures
The weekly clearly shows the market is consolidating. The Fibonacci retracement levels from the recent swing high and low indicate that the price is hovering around the 100 level (previous all time high). Bulls still need to see a decisive break above this in order to continue with the overall bullish momentum. RSI is currently in buy zone, and not much to note for now.
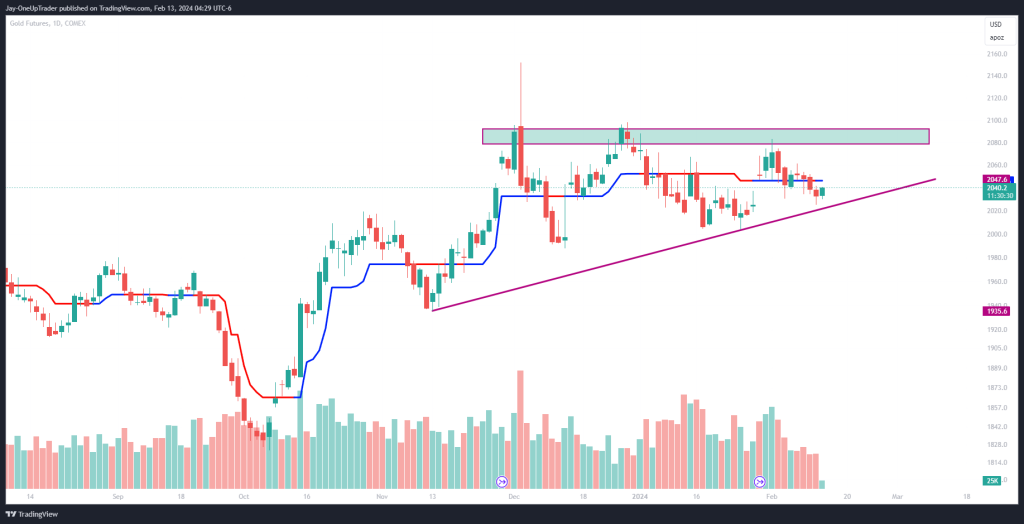
Daily Chart Analysis of Gold Futures
The daily chart presents a wedge pattern formation, which typically signals a continuation or reversal depending on the breakout direction. Currently, Gold Futures are trading near the bottom of the wedge and seem to be bouncing after a small test last week.
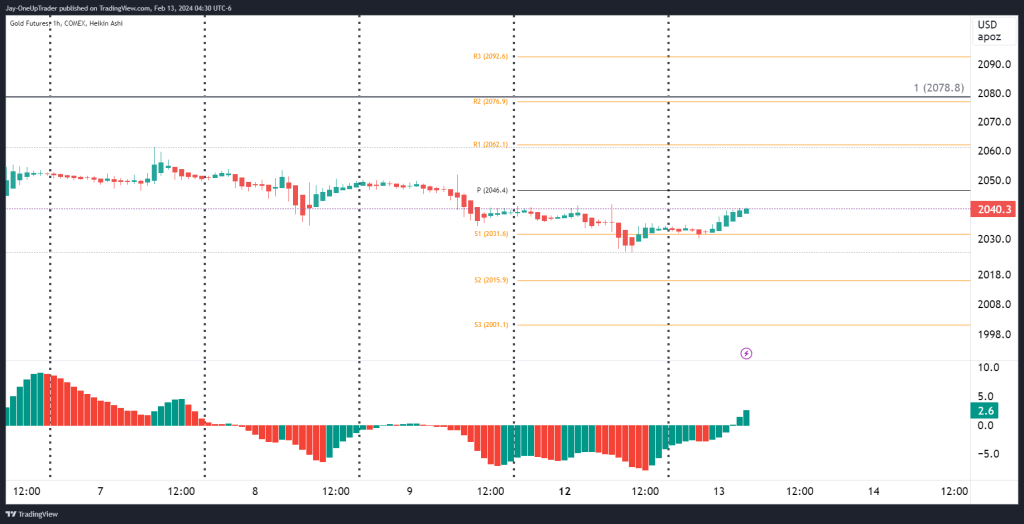
Hourly Chart Analysis of Gold Futures
We can observe that the pivot point at $2046.4 is acting as an immediate hurdle for the bulls. A break and hold above this level could give us the conviction to target the R1 pivot at $2062.1, followed by R2 at $2076.9. However, if the market demonstrates weakness, and we see a push below the pivot, the S1 level at $2031.6 will become our focus for potential support.
Key Levels to Watch
For the weekly chart, the critical zone to maintain a bullish bias is above $1834.2. The daily chart’s key level is the wedge’s resistance near $2080; a bullish breakout here could be very telling. On the hourly chart, pivot levels are our primary guide, with $2046.4 as our immediate reference point for potential bullish momentum.
Potential Trades
Based on our analysis, a long position could be considered on a strong break above $2040.1, with a stop-loss order placed just below the wedge support around $1935.6. The initial target would be the $2100 level. Alternatively, should the price break below the $1935.6 support, a short position could be initiated with a target at the $1834.2 level, setting a stop-loss above the breakout point to manage risk.