- RTY has been stuck in a very wide range since May
- Bearish trend line, anchored vwap, lightsaber candle stick and thick support level analysis
- A look at a new indicator that utilizes fractals
Quick Recap
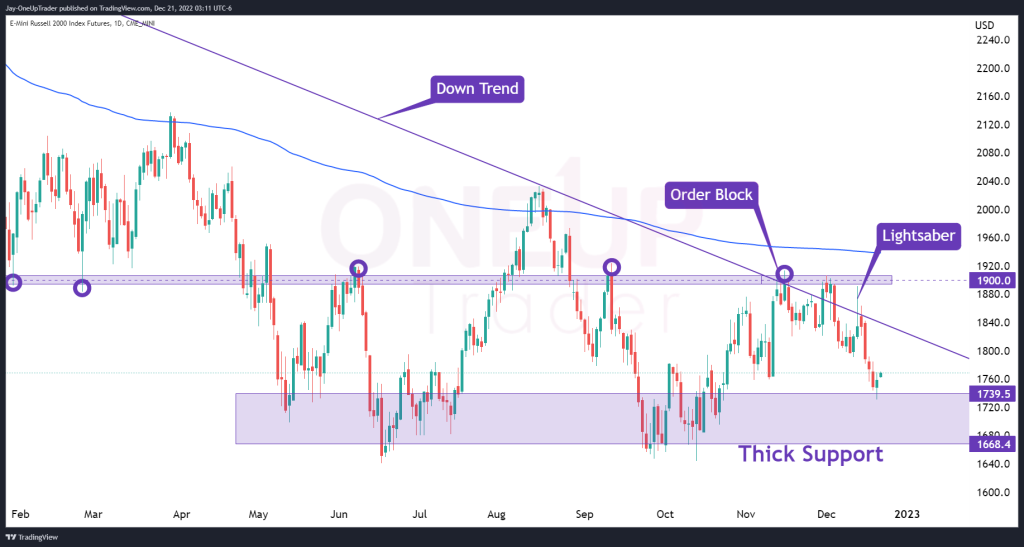
In our previous article, we analyzed the order block on the Russell and expected there to be a large amount of selling pressure as the price rallied into that zone. We see that price ultimately was not able to break through the order block and a sell-off has occurred. I want to point out some important factors we must pay attention to regarding RTY.
Bearish Trend Line
Like all the other indices, there is a bearish trend line that has been tested multiple times. The one on RTY seems to be forming a potential descending triangle. We can see this because of the lower highs but no lower lows at the thick support area on the chart below. This is a concern for bulls because if the price breaks below $1668, it could mean a further drop is likely. At the moment, it’s too soon to form price targets for the descending triangle because the market is still a way away from breaking through.
Anchored VWAP
Anchoring a VWAP to the high of the year, price has remained below the volume-weighted average price for 97% of the time, and there is no sign of this changing anytime soon. RTY is at the same price it was in early May which tells us that the selling has slowed down and the wide consolidation is likely to continue which gives great opportunities to range-bound traders.
Lightsaber Candlestick
The lightsaber candlestick is one very few know exist but it’s extremely powerful in determining swing highs and swing lows in markets. The lightsaber formed on December 13th and because it formed at the top of a retracement in an established trend it makes it even stronger. Traders could place stops above this candle and sell any rallies if they believe the downtrend will continue. To learn more about this candlestick pattern go here.
Thick Support
There is a very thick support level between $1739.5 and $1668.4. We can assume there will be a larger amount of buy orders here than normal and bears pushing below this will take a lot of effort too. This means we could see consolidation between the support level and the downtrend line for a while longer.
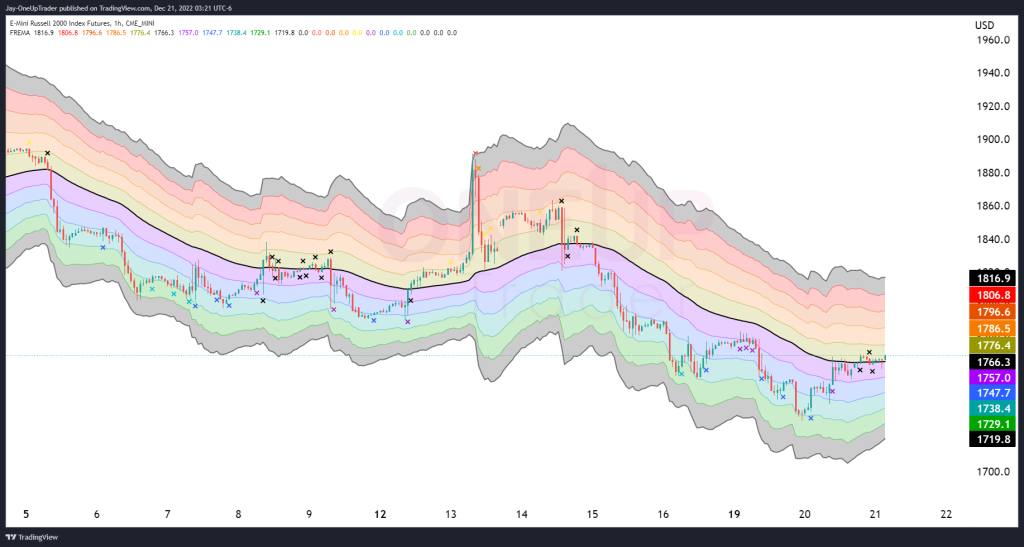
Fractal EMA Indicator
The fractal ema was developed by a trader on tradingview known as ‘fract’. It uses fractals in its calculations based on a central EMA and creates bands around it. If we notice that the overall trend is down on the longer-term time frames, we can use the fractal EMA indicator to begin selling short as the price rallies into the orange, red, or grey zone. This strategy would then recommend shorting at around $1796. Take a look at the chart below and a recent video we posted about it. To find the indicator on trading view, search ‘FREMA’.