


- Looking at the triangle pattern on the daily chart and potential targets.
- Heavy bearish divergence spotted on the hourly chart.
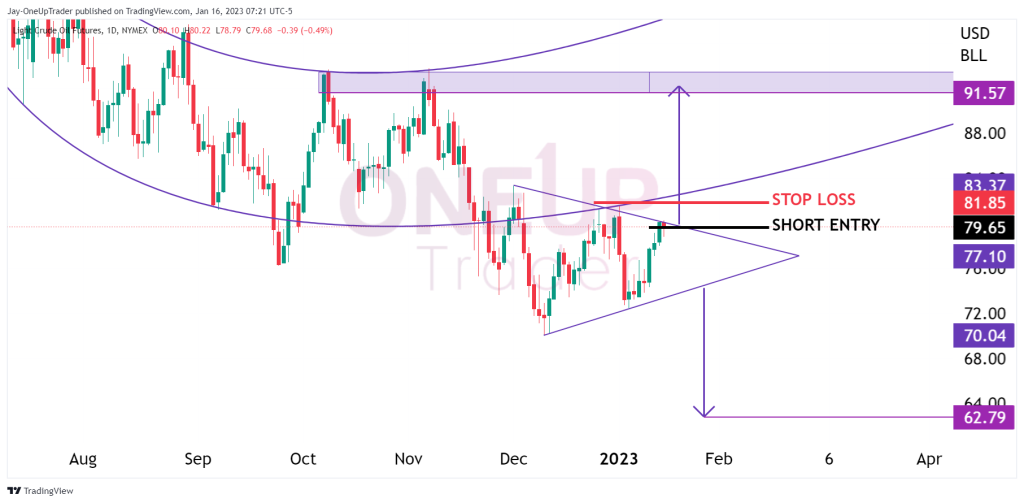
Daily Outlook
There is one main technical pattern we can look at on the daily chart for CL. That is the triangle pattern in which crude is trading at the top of its range which presents bears with a short opportunity with a very high risk-reward ratio. This is because stops can be placed above the recent swing high at $81.85. If CL breaks above that level, it’s likely that price is going to accelerate to the upside based on the targets when trading a triangle pattern. If that break does occur, then its likely CL would be targeting the $91.57 level. A bearish break of the triangle could lead to a significant fall to $62.79.
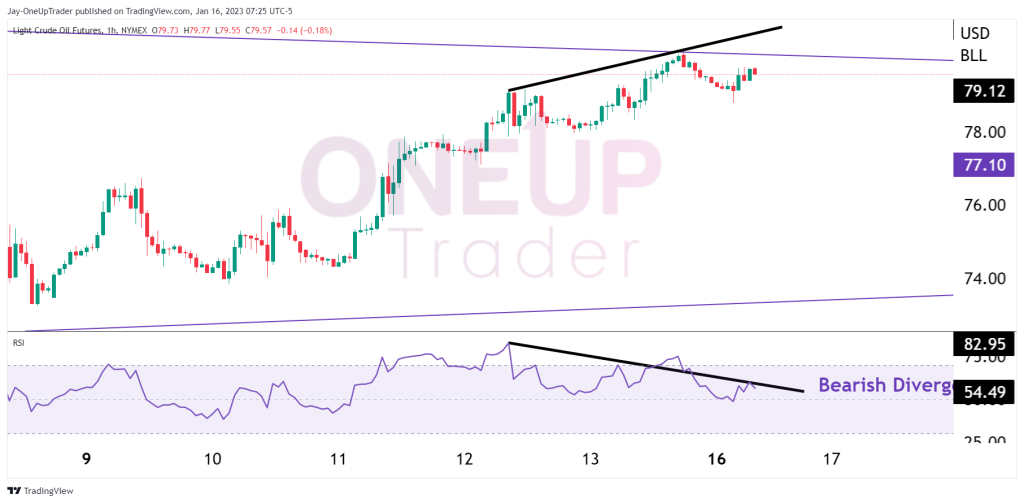
Bearish Divergence On The Hourly Chart
I want to highlight the strong bearish divergence on the hourly chart. CL has been overbought on this time frame for some time, likely due to the recent weakening of the Dollar. This divergence further strengthens the bearish trade mentioned above but it’s important to keep in mind that there are no certainties in markets. We can only think in probabilities.
