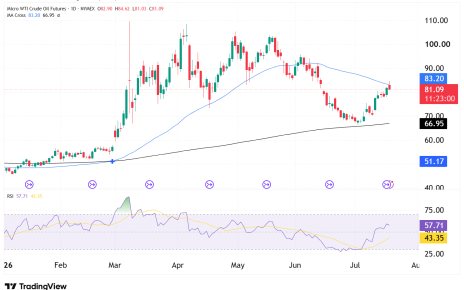
Introduction WTI crude closed up 15.6% last week, which is the highest weekly close since April. There is resistance now at the 50-day MA, so the question is whether the selling power will be strong enough to push prices back down toward $70 or if the bulls will be strong enough to continue with this Read More…
Gold retraces from its downtrend, offering bears a short opportunity. Trader mindset announcement. Last time we looked at Gold On February 24th, I mentioned how we should be sitting on our hands until we saw a potential short squeeze in GC futures. Sometimes we just have to accept the fact that there are no opportunities Read More…
Overview of the U.S. Dollar Index (DXY):The U.S. Dollar Index (DXY) is currently trading around 101.724, showing a recent bounce from a key support level. The DXY has been in a broad descending wedge pattern, which is generally considered a bullish continuation pattern. The bounce from 100.8 to 101.724 is significant, as it coincides with Read More…


