


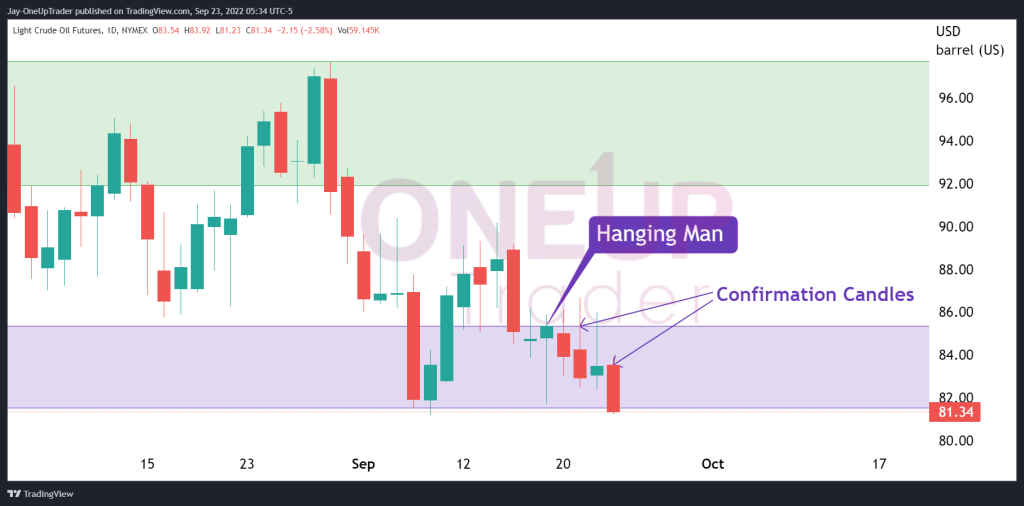
- The hanging man candlestick pattern is confirmed on the daily chart
- The target for Bears is below the $81 price level
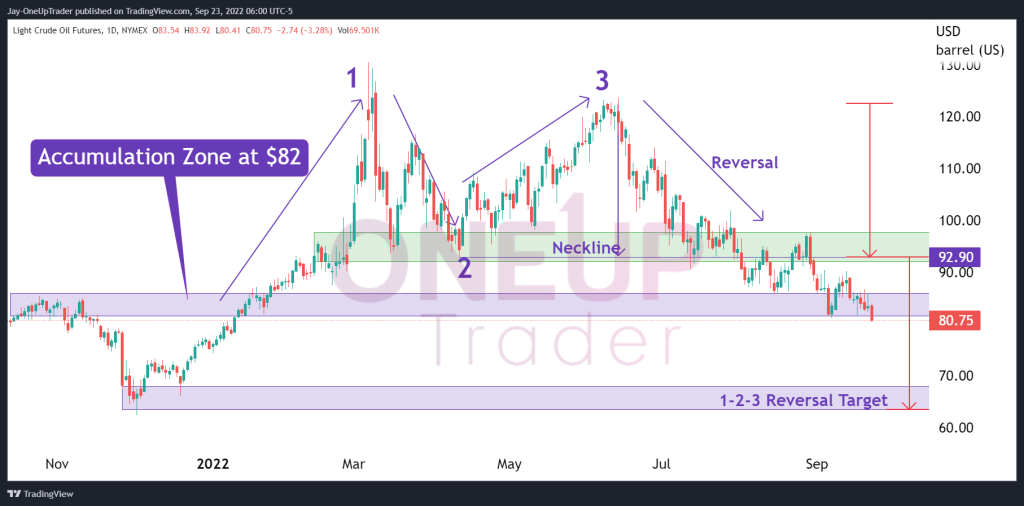
- Accumulation Zone around $82 broken to the downside
Hanging Man CandleStick
Earlier in the week, we analyzed the potential formation of either a hammer or a hanging man candlestick confirmation. Looking at the daily chart, the hanging man has been confirmed with at least two red candles printed. This is a bearish sign for CL; learn more about the Hanging man pattern formation here.
Long Term 1-2-3 Reversal, Bearish below $81
Our analysis covered the 1-2-3 reversal pattern a few times because of its reliability. To learn more about this pattern, go here.
The daily chart shows a solid 1-2-3 reversal pattern on CL, with our 1st point forming in March, the 2nd point (pullback) in April, and the 3rd point (re-test of 1st level) in June. The Neckline, which is just the low of the 2nd point, is at $92.90, and CL has already broken below that. The bearish break, coupled with the Hanging man pattern, gives a very bearish outlook for CL in the medium term.
Accumulation Zone
The accumulation zone at $82 has also been broken to the downside. Many traders with long positions would likely be getting liquidated around these prices because of the stop losses below the accumulation zone of $82.
Targets
The bearish targets are around the $70 level in the medium to long term; the 1-2-3 Reversal gives us a predictable area to aim for by measuring the distance between the 3rd point and the Neckline. This target is also at a support zone where prices traded before 2022.
