

- NQ has been in the red four out of the last five days
- The hourly trend line has broken to the downside
- NQ is currently trading within a minor support zone at the 23% Fib level
Medium Term Outlook
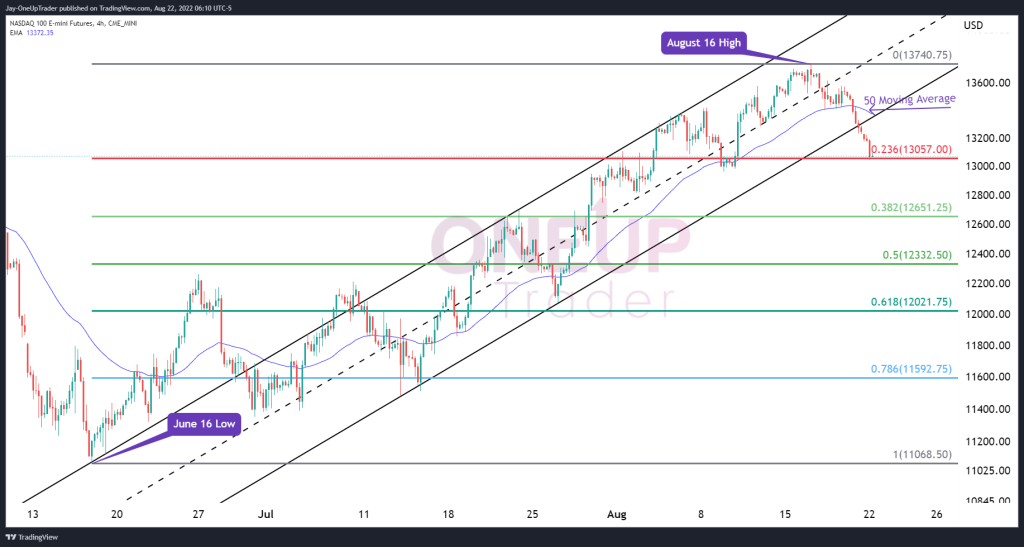
The 4-hour chart on NQ has shown a strong uptrend channel since July of this year. The 50 exponential moving average (EMA) has also been holding as a support indicator, with prices frequently finding buyers once a retracement occurs. We have recently seen prices fall steeply, with red candles printed four out of the last five trading sessions.
Drawing a Fibonacci retracement from the June 16 Low to the August 16 High, the tech-heavy index has fallen to the 23% Fib level of $13,057 (Red dashed line on chart). Our Bearish case is that prices could fail to find enough bids at this level and may fall to the next fib line of 38% at $1,2651.25. Our Bullish case is that prices could find support leading to a relief rally to the 50 EMA. A V reversal is always an unlikely outcome so even though a short-term rally may be on the cards; we cannot rule out a test of the 23% fib level for a second time.
Short Term Outlook
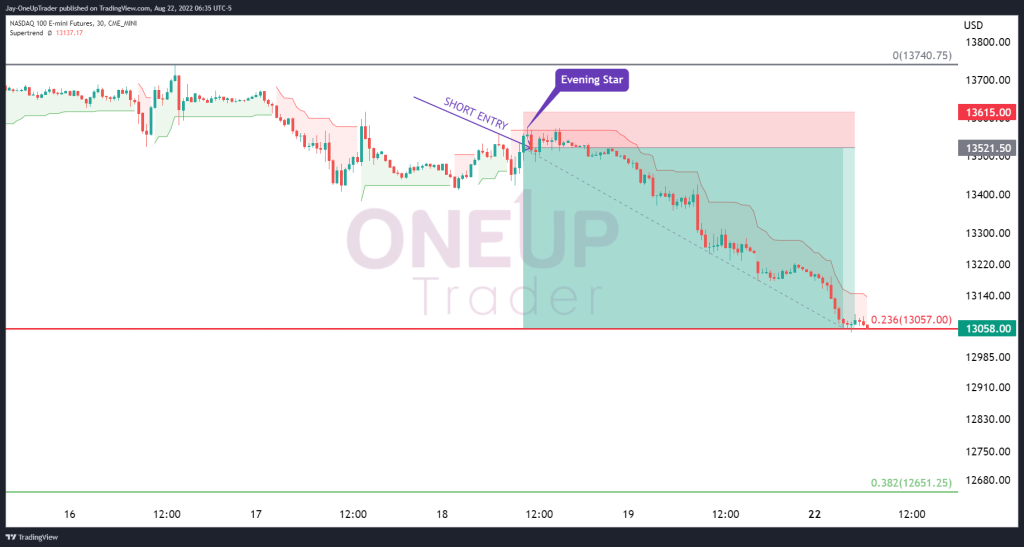
Looking at the 30-minute chart, the super trend indicator, as expected, has been red, indicating that short trades have a higher probability of success for the past few days. Usually, when our technical analysis of the longer-term chart points in a certain direction, we can wait for a retracement on lower times frames and use the super trend line as an entry zone to go with the longer-term trend.
There was a potential short trade on August 18th when prices bounced off the super trend line and formed an evening star pattern. That trade is still in profit, and at the time of writing this article, prices seem to be attracting lower levels. Cautiously taking short trades off the super trend line could yield one or two more profitable trades as long as stop losses are wide enough to give the trade room to breathe.
Bears are in control at the start of this week’s trading; we will have to see how Mondays and Tuesdays sessions finish with an idea of whether the bearish momentum is slowing or gaining even more traction.
