Author
Samwel Fedha
Analysis Strategies Technical Analysis Trading Tips

4 Pivot Points Trading Strategies

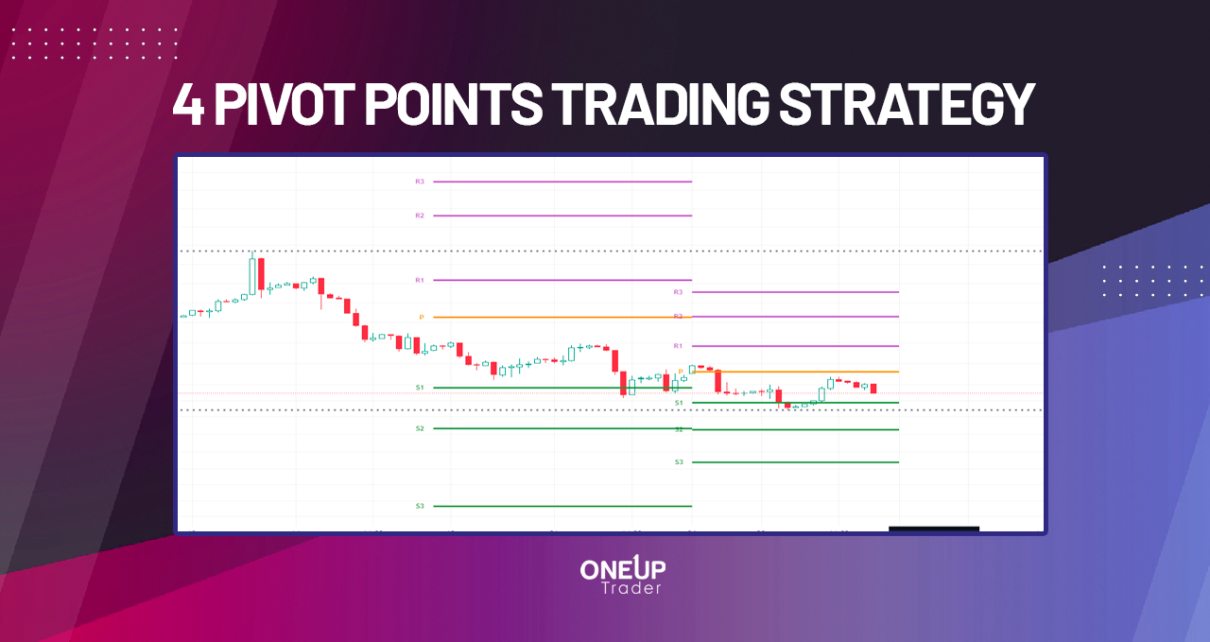
Inarguably, support and resistance levels are the cornerstones of most price action trading strategies. And with pivot points, you can easily set the support and resistance levels on any timeframe. The pivot points’ support and resistance levels are static, designed to predict potential turning points within the trend. This makes them invaluable for determining optimal Read More…

Engulfing candlestick pattern
Strategies Technical Analysis Trading Tips

Engulfing Candlestick Pattern

The engulfing candlestick pattern signals potential trend reversals. And since candlesticks patterns are not laggy, you have a higher probability of catching the onset of a trend. Throughout this guide, we’ve discussed how you can identify bullish and bearish engulfing candlestick patterns and how you can use them to trade market reversals. What is the Read More…

Strategies Trading Tips

Bollinger Bands Indicator Trading Strategies

Market volatility is an important aspect of price action trading, and with the Bollinger Bands indicators, you can easily visualize an asset’s volatility. It shows how the price fluctuates around an average value, in this case, around a moving average. By the end of this guide, you should understand how the Bollinger Bands indicator works, Read More…

Analysis Strategies Trading Tips

What is Price Action Trading and How to Learn It

Despite their various advantages, nearly every technical indicator is faulted for lagging. Price action trading eliminates the overreliance on technical indicators simply by using candlestick and chart patterns to identify optimal entries and exits. The basis for price action trading is pure market movement; in a sense, price action trading is the foundation of all Read More…

Ichimoku Cloud Indicator
Strategies Technical Analysis Trading Tips

Ichimoku Cloud Indicator Trading Strategies

The Ichimoku cloud indicator, also called the Ichimoku Kinko Hyo, is arguably one of the most versatile technical indicators. At first glance, it may appear convoluted and probably hard to understand, especially due to the several components. However, its greatest advantage is that it combines backward and forward-moving averages to determine an asset’s trend, momentum, Read More…

Exponential moving average
Analysis Strategies Technical Analysis Trading Tips

Exponential Moving Average: What is the EMA Indicator?

Moving averages (MAs) are among the most popular technical trading indicators. Their popularity majorly stems from their simplicity and versatility – they are easy to calculate and use; can be used to show both a price action’s trend and strength. Thanks to their popularity, several variations of the moving average exist. This guide will discuss Read More…

Bear and bull flag pattern
Analysis Strategies

Bear and Bull Flag Pattern Trading

Continuation chart patterns occur in a trending market and typically indicate a momentary period of price consolidation before the market continues trending in the previously observed trend. This guide focuses on one such chart pattern – the flag chart pattern. We’ll break down the bear and bull flag pattern trading. What is the Flag Chart Read More…

Fibonacci retracement levels
Strategies Trading Tips

How to Use Fibonacci Retracement Levels

Trading the support and resistance levels of an asset is probably one of the oldest and most reliable technical strategies. It goes without saying that asset prices never trend in a straight line – any trending market is often punctuated with momentary pullbacks or retracements. This is where Fibonacci retracement levels come in. These levels Read More…

False breakout candle pattern
Strategies Trading Tips

False Breakout Candle Pattern

Breakout trading is the cornerstone of most technical indicators. It’s usually the simplest way to gauge the magnitude of a trend. And regardless of your trading strategy, you’re bound to experience some false breakouts, which will kill your strategy. So, how do you avoid false breakouts? And more importantly, how do you take advantage of Read More…

MACD indicator
Strategies Trading Tips

How to Read MACD Indicator – Explained

Moving average convergence divergence (MACD) is one of the most versatile technical indicators – it’s both a trend and momentum indicator. The MACD indicator can best be described as a 2-in-1 indicator; it shows the start of a bullish or bearish trend using the MACD crossover and the strength or weakness of a trend with Read More…