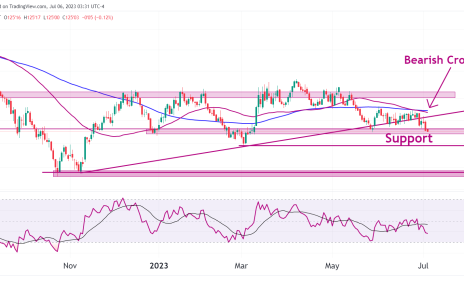
- RTY’s downward move continues with heavy resistance impact and aggressive selling.
- The resistance zone has the POC line, 50% Fib level, and bearish candlestick patterns within it.
- Why it could be best to sit on our hands.
Recap
We pick up from where we left off as RTY has continued to plunge after we suspected a potential triple top last week. The sell-off has accelerated and a likely cause of that is the volume profile point of control line. This aggressive selling could also be the result of the formation of a bearish engulfed on the daily chart within the resistance zone and the rejection off the 50% line, all of which we will analyze in this week’s technicals on the Russell.
Technical analysis
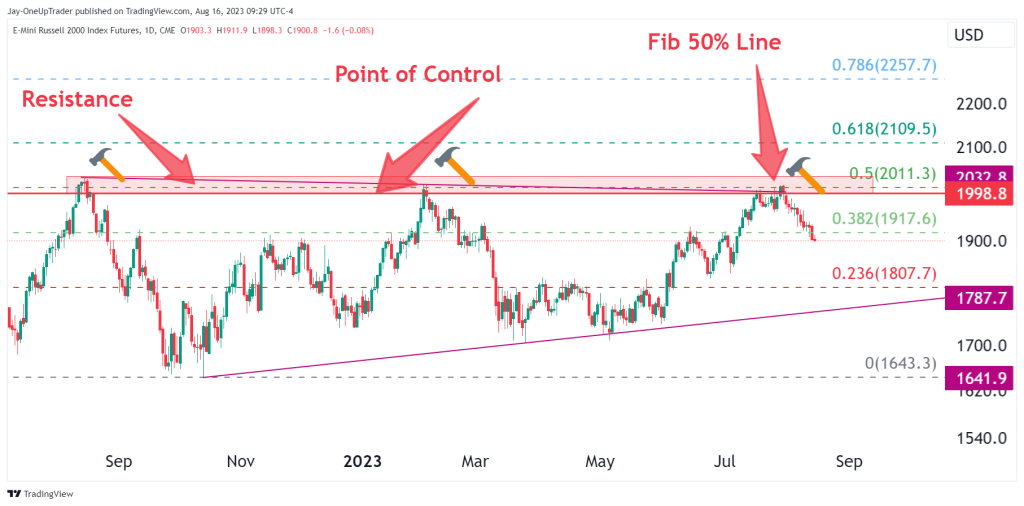
Resistance: The resistance zone marked on the chart below in red has seen the formation of a triple top. It is important to note that there was no prior up trend to this formation, so the downside is limited compared to if there was a strong up trend before the creation of the pattern. This level is significant for a few more reasons:
Point of Control: The POC for the volume profile line is within this resistance zone which added further fuel to the bearish case last week.
50% Fib Level: The 50% Fib level also comes within this zone.
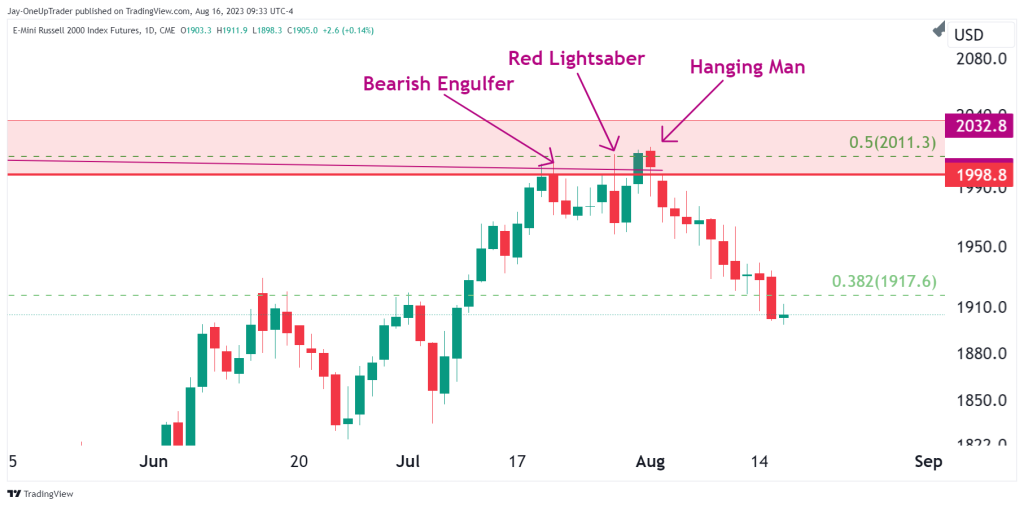
Bearish Candles
There 3 important bearish candles that gave us potential entries as the price moved into the resistance zone. I have zoomed into the chart to show the formation of a bearish engulfer, a red lightsaber, and a hanging man pattern, all of which we could have taken shorts from.
Dark Cloud Cover: It forms after an uptrend and consists of two candles. The first candle is a strong bullish one, followed by a second bearish candle that opens above the first candle’s close but closes below its midpoint. This pattern suggests potential trend reversal and warns of a potential downturn in the market.
Bearish Engulfer: It forms when a small bullish candle is followed by a larger bearish candle that completely engulfs the previous candle’s body, indicating a potential trend reversal to the downside.
Red Lightsaber: It forms when price breaks well above the high of the previous candle and after an uptrend. It closes below the low of the previous candle and is usually 2 or more times greater than the surrounding candlesticks.
Ending Off
Let’s wait and see where RTY finds support. Taking longs here is very risky as it would be catching a falling knife. We are better off waiting for a consolidation phase or support at the 23% level. It may be the best time now to just sit on our hands.