

Introduction
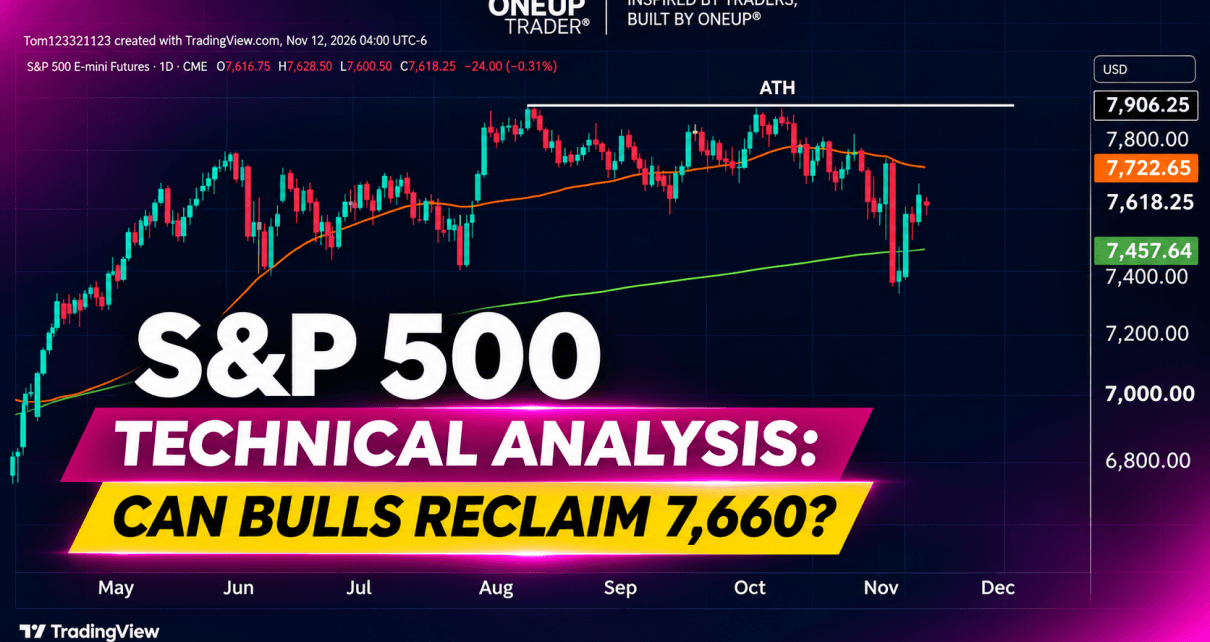
S&P 500 futures have recovered a lot of the sell-off that we saw in early November when price dipped below the 200-day moving average. A lot of that was driven by the bearish AI trade and the scandal with the NVIDIA CEO, Jensen Huang.
Now that ES is back above the 200-day MA, does it mean that the selling is over and we will recover to a new ATH?
Let’s take a closer look at the technicals and what they are telling us.
What is the daily chart telling us?
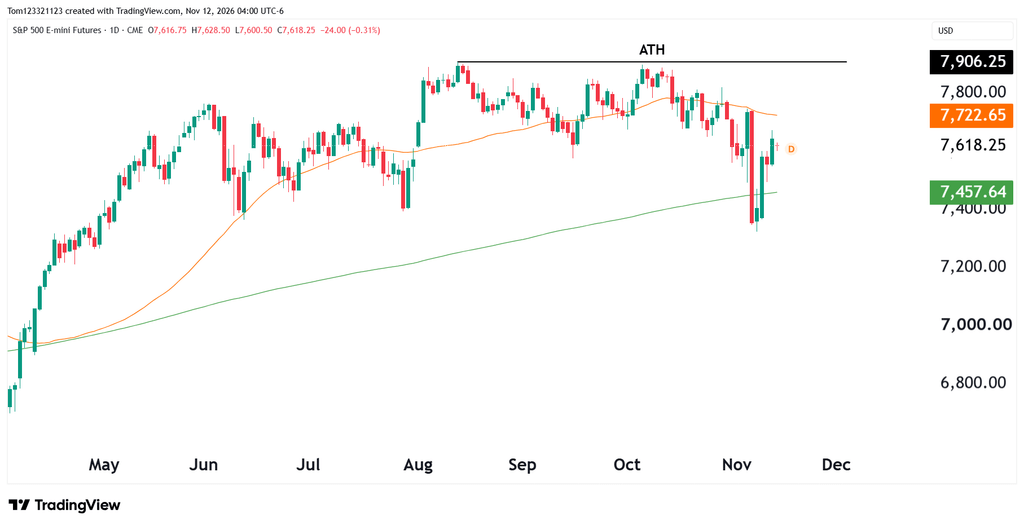
The best sign for the bulls is how little time ES spent below the rising 200 moving average. Last week’s selloff took price through it and down to roughly 7,320, but buyers recovered the average, now at 7,457.64, and carried the rally another 160 points beyond it. That gives the longer-term uptrend a chance to continue.
What still favors the bears is where the selling began. The 50 moving average turned lower in October, and the last rally into it was followed by the biggest red candle on the chart. That average now sits at 7,722.65. Even if buyers clear 7,660, they’ll meet that next test about 63 points later.
A daily close above 7,660 would be encouraging, particularly if the next pullback finds buyers there. Above 7,723, the path opens toward 7,800, with the all-time high at 7,906.25 further out. If ES slips back below 7,600 and fails to recover it, 7,500 and the rising average near 7,458 are the first downside levels to watch.
Possible ES trades
Long setup: On the hourly chart, look for a close above 7,660 followed by a pullback that holds the level. A higher low would give the setup a clear place for a stop, with 7,723 as the first target. If ES runs straight to the moving average without a retest, much of the room for that trade has already gone.
Short setup: If sellers push ES below 7,600, watch what happens when price returns to it from underneath. An hourly candle that tests 7,600 and closes back below it would support a short toward 7,500, then 7,458. A stop above the rejection high defines the risk.
After a 300-point recovery, there’s little reason to guess which way ES will break from inside the zone. Let the hourly chart show which side can hold the level, and size the trade around the distance to the stop. If that distance is larger than the room to the first target, the setup can wait.
For educational purposes only. Futures trading involves substantial risk, and stop orders do not guarantee an execution price.