

4 November 2026
In our 2 November Nasdaq analysis, we were watching for buyers to defend support near 28,778. That level gave way, and the move below 28,245 invalidated the first long setup we outlined.
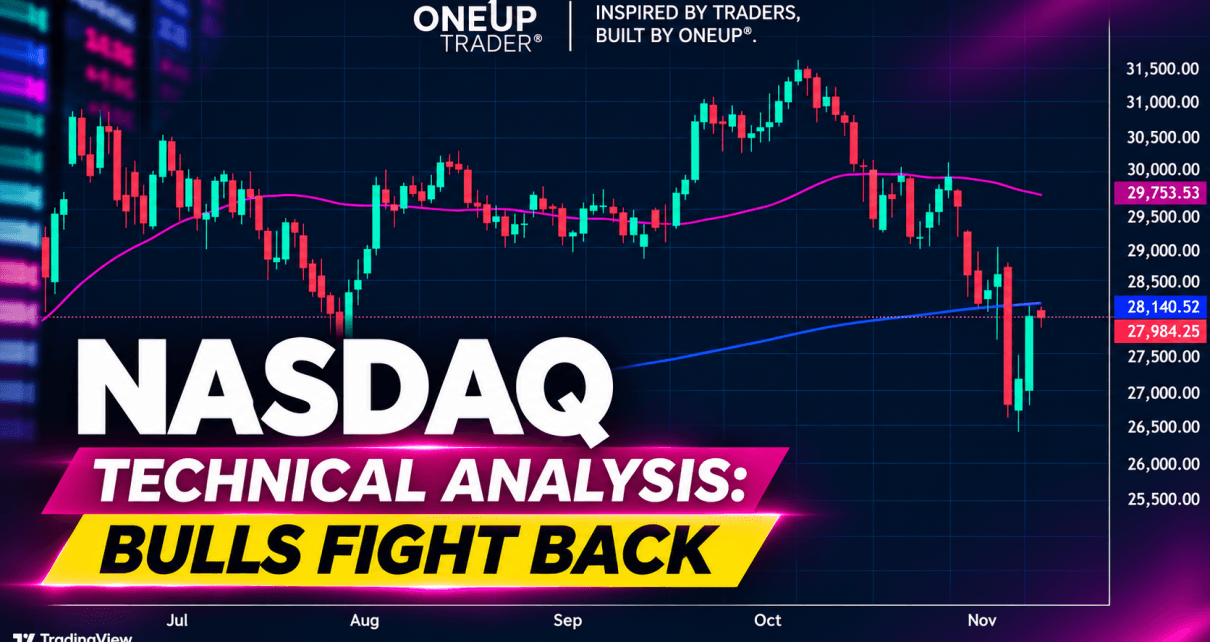
What makes today’s session interesting is how quickly buyers responded to the drop. Nasdaq 100 E-mini futures fell to 27,615.75 before recovering to 28,548.75 at the time of writing. That’s a 933-point bounce, but it still leaves NQ just below the support zone it lost. For traders looking at longs, the question now is whether buyers can get back above 28,800 and hold it on the next pullback.
What is the daily chart telling us?
The strongest point in the bulls’ favor is the fact that bulls have recovered so quickly; it shows that there is still a lot of buying interest. Sellers pushed NQ well below the rising moving average at 28,310, but buyers brought it back above that level and close to the session high. The daily candle is still open, so where it closes matters. A close above 28,800 would put price back inside the range that held for much of the summer. A close below 28,310 would mean buyers gave up the moving average despite the morning recovery.
The October selloff also gives us a reason to be patient. After NQ lost 31,000, two rallies stalled near 30,000 before price broke lower again. The faster moving average has since turned down to 29,727, making the area just below 30,000 the next significant test if buyers reclaim 28,800.
Support and resistance levels for NQ
| Support | Resistance |
|---|---|
| 28,310 — rising daily moving average | 28,600–28,800 — former support, now the first hurdle |
| 27,616 — 4 November session low so far | 29,727–30,000 — falling moving average and recent rally highs |
| 27,200 — late-July low area | 30,800–31,000 — upper resistance zone |
Possible NQ trades
Long setup: On the hourly chart, look for a close above 28,800 followed by a pullback that holds the level. That gives traders a higher low to place a stop beneath, with 29,200 as an initial target. If buyers clear it, the next area to watch is 29,727–30,000.
Short setup: If NQ rallies into 28,600–28,800 and an hourly candle closes back below the zone, 28,310 is the first downside level to watch. A break below that moving average followed by a failed attempt to recover it would bring the session low near 27,616 back into play. A sustained move above 28,800 would invalidate the short based on that rejection.
This analysis is for educational purposes only. Futures trading involves substantial risk of loss.