


Introduction
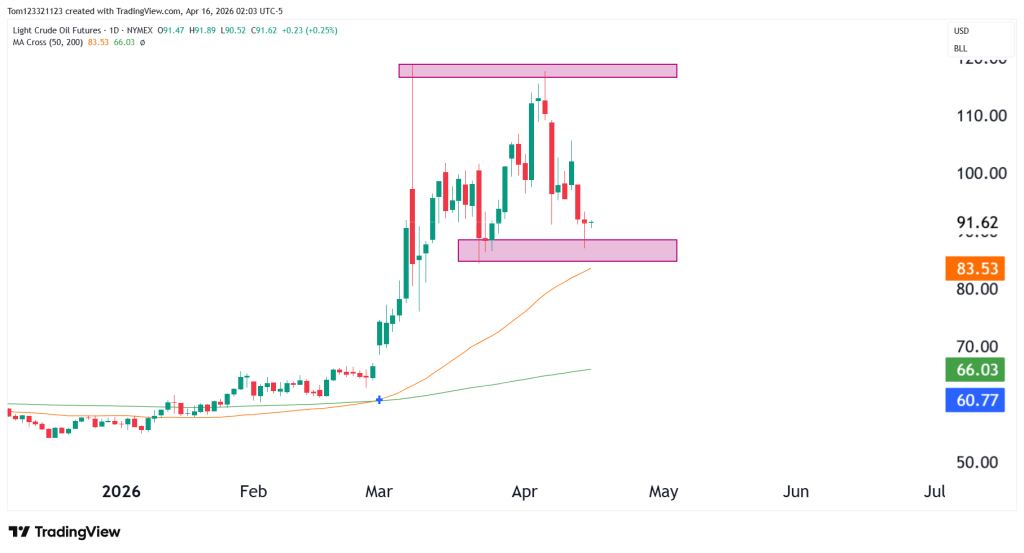
Crude Oil has rallied from $55 at the start of the year to a high of $118 in March, as we know by now, due to the terrible escalations in the Middle East. After the top was made, price moved around with a lot of volatility in price discovery. Last week, price attempted to hit the top again and now retraced back to $91.4.
This market is driven purely by the situation in the Middle East, so technicals have little bearing on price action now. With that said though we can use it for targets and look for any patterns forming to trade from. The volatility is slowing down, and price action is starting to settle in more, which means it’s becoming a friendly environment for swing traders to start taking positions.
Key Levels
Price is sitting between a zone that is forming a range.
Resistance:
- ~$112–115 (recent highs / rejection zone)
Support:
- ~$88–92 (current demand zone)
- ~$83 (50-day MA area) just below
This $88–92 area is critical for the bulls. If it holds, the structure remains bullish and this becomes a higher low.
Middle East Updates
The earlier rally in crude was heavily influenced by:
- Escalation risks in oil-producing regions
- Supply disruption fears (shipping routes, production concerns)
- Broader geopolitical uncertainty
More recently, de-escalation signals, including ceasefire developments and reduced immediate threat to supply routes, have taken some pressure off prices.
That aligns with what we’re seeing technically:
- Risk premium expanded price quickly
- Now that premium is being partially unwound
This doesn’t mean risk is gone. It just means the market is repricing the probability of disruption.
Scenarios and Probabilities
| Scenario | Description | Estimated Probability |
|---|---|---|
| Higher Low | Support holds (~88–92) → continuation higher | 45% |
| Range Build | Chop between ~88 and ~110 before next move | 30% |
| Deeper Pullback | Break below ~88 → move toward mid-$80s or lower | 25% |
Possible Trades
- Longs: More attractive near $88–92, but only with clear reaction
- Breakouts: Only valid if price can reclaim momentum above $100–105
- Shorts: Become more compelling on a clean break below support, especially if momentum expands
Final Takeaway
Crude oil pushed higher on the back of strong, news-driven momentum, but that move is now being tested as the market starts to cool off a bit. The recent pullback doesn’t necessarily break the broader uptrend, although it does begin to put some pressure on it and raises a more important question about what’s really behind the move.
At this point, it comes down to how buyers respond. If they step back in with real conviction, it would suggest the trend still has strength and room to continue. If they don’t, and price struggles to regain momentum, it may point to the rally being driven more by short-term fear and headlines rather than sustained demand.
In this kind of environment, price action tends to speak louder than the narrative, often hinting at a shift before the story becomes obvious. Right now, the market isn’t clearly choosing a direction, but it is starting to test whether that earlier strength can actually hold.
This analysis is for educational and informational purposes only and does not constitute trading advice. Futures and forex trading involve significant risk and may not be suitable for all investors. Always conduct your own research before making trading decisions.

