Introduction
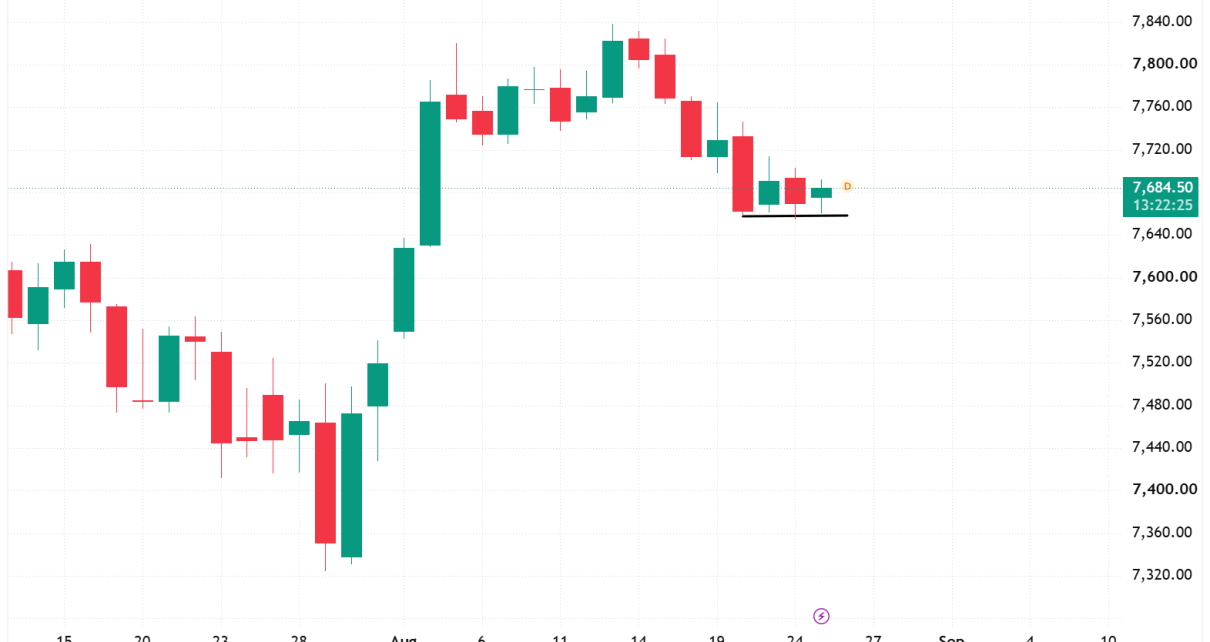
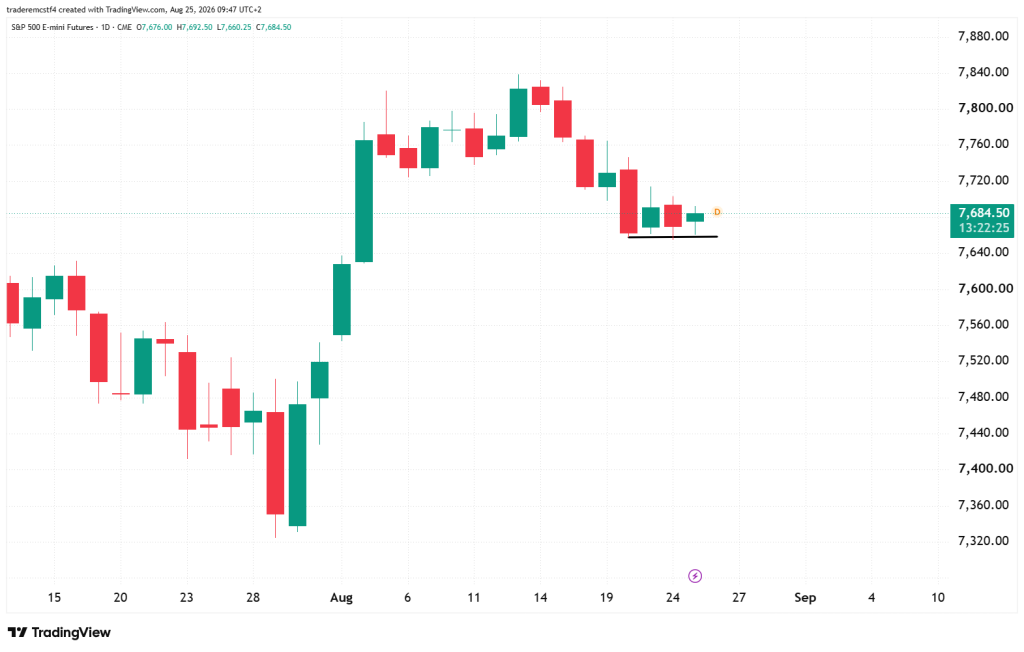
ES is coiled between 7,657 and 7,700. The pullback from the 7,840 record set on 13 August is 2.33%, and the 7,657 floor has held four sessions in a row. Daily range has compressed hard — the 25 August session covered 32 points, against 60 to 80 during the sell-off and over 100 during the early-August advance. A break above 7,700 puts 7,840 back in play. A break below 7,657 opens 7,500.
The Week Ahead, in Context
- Nvidia reports Wednesday after the close. The stock fell more than 2% on Monday ahead of the print.
- Warsh delivers his first Jackson Hole keynote as Fed Chair on Friday, the same morning July core PCE is released and expected at 0.2% month-on-month, up from 0.1%. The 10-year sits near 4.74%, close to 20-month highs.
- The administration is previewing expanded Iran sanctions, and US-Canada trade talks collapsed on Monday.
Possible Trades
Bullish continuation
- Entry trigger: daily close above 7,700
- Stop: below 7,657
- Target: 7,840
Breakdown
- Entry trigger: daily close below 7,657
- Stop: above 7,700
- Target: 7,500
Trading futures involves substantial risk of loss and is not suitable for all investors. Past performance is not indicative of future results. This analysis is for informational and educational purposes only and does not constitute financial advice. Always conduct your own due diligence and consult with a licensed financial advisor before making any trading decisions.