Introduction
This is a follow-up to the 15 July analysis, where price was sitting around 52,901 with room to run toward 53,500–54,000 before hitting real resistance. The price has not changed much since then but did get a small bounce off the 78% Fib level and now bulls look to be finding their footing before making another move higher.
Dow Jones Futures Trend Analysis
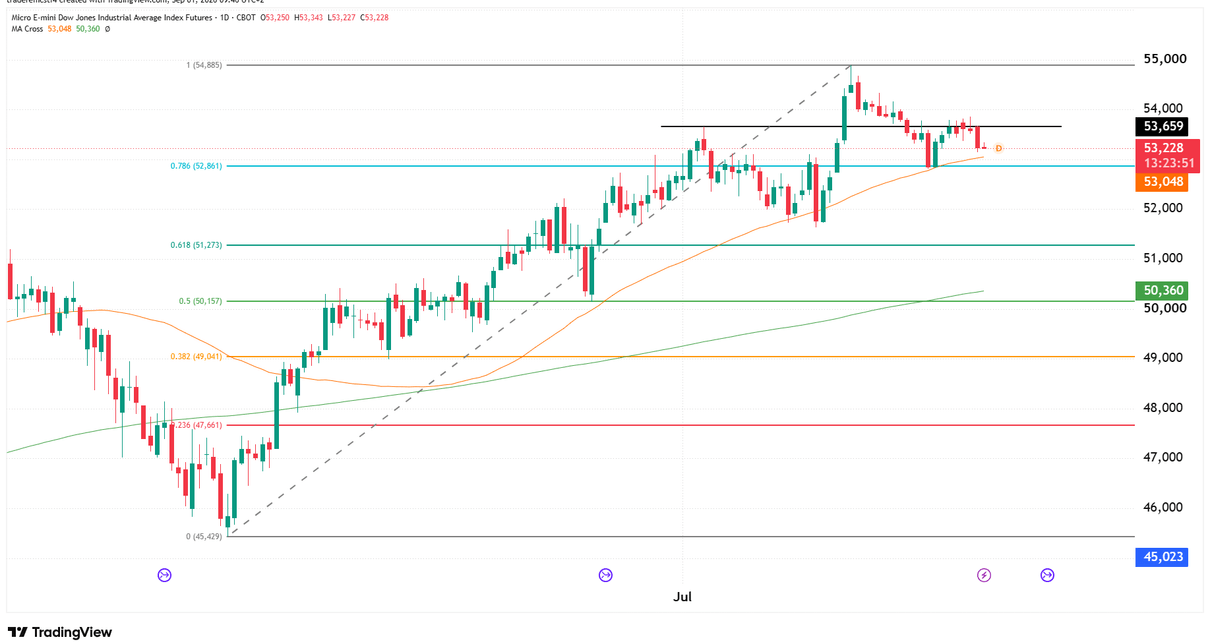
The picture has changed since July. Rather than a clean uptrend inside a rising channel, price has now put in a lower high and is grinding sideways-to-lower beneath the 53,659 level, which has capped several attempts over the past few weeks.
Price is currently sitting almost exactly on the 50-day MA (53,048) and the 0.786 Fibonacci retracement of the April–August advance (52,861). That’s a confluence of two support references in the same narrow band, making this a more meaningful test than a single-level touch.
The 200-day MA (50,360) is still well below price and rising, so the longer-term uptrend remains intact — this is a correction within a larger trend rather than a structural breakdown at this stage.
Key Levels
| Level | Notes |
|---|---|
| 54,885 | August high, the 1.0 Fib reference |
| 53,659 | Horizontal resistance capping recent attempts |
| 53,048 | 50-day MA, currently being tested |
| 52,861 | 0.786 Fib retracement, overlapping with the 50-day MA |
| 51,273 | 0.618 Fib retracement, next meaningful support below |
| 50,360 | 200-day MA |
Possible Trades
Scenario 1: MA and Fib confluence holds, bounce back toward resistance With the 50-day MA and 0.786 Fib sitting in the same narrow band, a bullish reaction here is a reasonable outcome given the longer-term trend is still up.
- Entry: Bullish reaction near 53,048–52,861
- Stop: Below 52,861
- Target: 53,659, then the August high if that level clears
Scenario 2: Confluence fails, deeper retracement Price has already put in a lower high, and a close below this support band would confirm the correction has more to run.
- Trigger: Daily close below 52,861
- Target: 51,273 (0.618 Fib), with 50,360 (200-day MA) below that
Scenario 3: Range between 52,861 and 53,659 Continued chop between the support confluence and the horizontal resistance is also plausible until one side gives way.
This analysis is provided for educational and informational purposes only and should not be considered financial or trading advice. Trading futures, forex, and other leveraged financial instruments carries a high level of risk and may not be suitable for all investors. Past performance is not indicative of future results. Before making any trading decisions, conduct your own research, assess your risk tolerance, and consult with a qualified financial advisor if necessary.