

Introduction
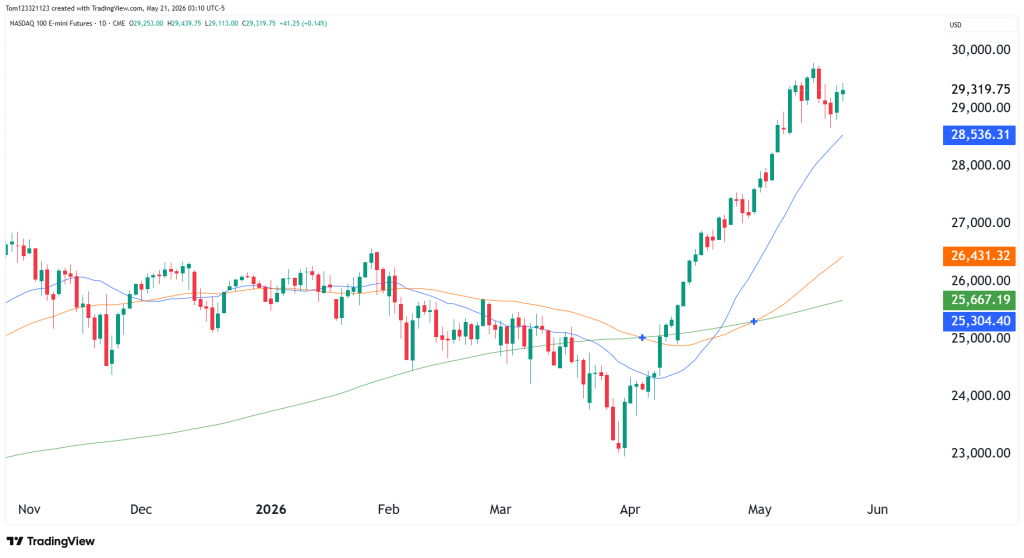
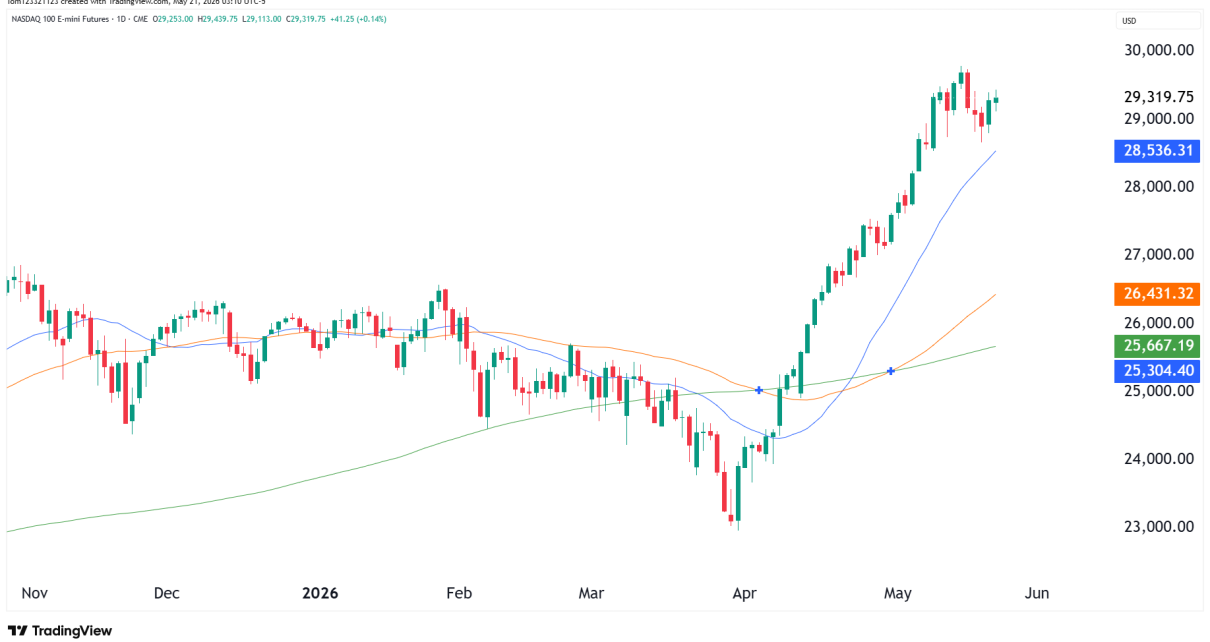
Following strength in other US equity markets, the Nasdaq 100 E-mini futures continue to show strong momentum after the aggressive recovery from the April lows. Following the sharp selloff during March and early April when the crisis in the Middle East was at its highest, buyers stepped back into the market and pushed NQ back above all major moving averages and to new all-time highs.
From here, we are looking to see if the price action is sustainable for the short to medium term or if the rally has been too hot and a pullback is more likely. Let’s take a closer look at the technicals and see if we can find any clues.
Bearish Divergence On Daily Chart
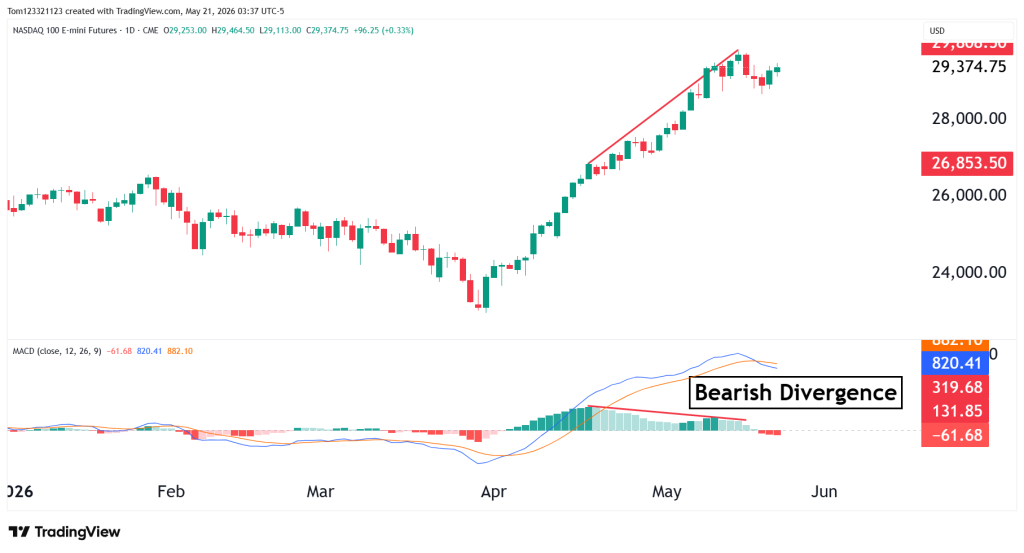
Remaining on the daily chart, there is bearish divergence forming on the MACD indicator, and the histogram has turned red, which is the first time since April. This is telling us that even though price has made a new high, the MACD is not confirming the strength. More often than not, this leads the price into either a consolidation, a pullback, or even a trend reversal. Nothing is guaranteed in trading, as traders, we just look at probabilities.
Analyzing the chart from this perspective and time frame, the buying power is slowing down, this means that we could see a period of time where price starts to move sideways for a while. Long opportunities might be gone for now but it depends on the time frame.
Key Support and Resistance Levels
Major Resistance Levels
- 29,500
- 30,000
- 30,500
Major Support Levels
- 28,536 (21-day moving average)
- 26,431 (50-day moving average)
- 25,667 (200-day moving average)
Possible Trades
Bullish Continuation Trade
Possible buying opportunities:
- Strong closes above 29,500
- Bullish continuation candles after consolidation
- Successful retests of breakout levels as support
- Momentum continuation above the 21-day moving average
Pullback Trade Setup
As long as NQ remains above the 21-day moving average, we could continue watching for pullback opportunities within the broader uptrend.
Possible signals include:
- Bullish rejection candles near support
- Higher low formations
- Momentum recovery after shallow pullbacks
- Buyers stepping back in near moving averages
Bearish Rejection Trade
Although the primary trend remains bullish, we can keep in mind the divergence and the possibility of a consolidation period or pullback.
Potential bearish signals may include:
- Failed continuation above 29,500
- Large bearish reversal candles
- Breakdown below the 21-day moving average
- Increasing volatility near highs
Final Thoughts
NQ futures remain in a strong bullish trend following the aggressive recovery from the April lows. Buyers continue maintaining control above all major moving averages while momentum remains firmly bullish heading into the end of May.
The 28,500 region near the 21-day moving average now becomes one of the most important support levels to monitor. As long as buyers continue defending that area, the broader bullish structure remains intact.
Ready to put your analysis into action? Start your evaluation with OneUp Trader and save 10%!
This analysis is provided for educational and informational purposes only and should not be considered financial or trading advice. Trading futures, forex, and other leveraged financial instruments carries a high level of risk and may not be suitable for all investors. Past performance is not indicative of future results. Before making any trading decisions, conduct your own research, assess your risk tolerance, and consult with a qualified financial advisor if necessary.
Let us know what you think will happen in the Nasdaq in the comment section below.
