

One of the most valuable tools in a trader’s arsenal is the concept of divergence trading, especially in today’s markets. Divergence occurs when the price of an asset and a technical indicator, such as the Relative Strength Index or MACD, move in opposite directions. This can provide insights into the underlying strength or weakness of a trend and can be used to identify reversals or consolidation phases.
Divergence may be bullish or bearish. When an asset’s price is making lower lows while the indicator is making higher lows, this is known as bullish divergence. This suggests that the downward momentum of the trend is waning and that an upside reversal may be possible. When an asset’s price reaches higher highs while the indicator reaches lower highs, this is known as a bearish divergence. This indicates that the uptrend’s momentum is waning and that a potential downside reversal may be imminent.
What Does Trading Divergence Mean?
Divergence trading refers to the discrepancy between the price of an asset and the movement of a technical indicator. When an asset’s price is making lower lows while the indicator is making higher lows, this is known as bullish divergence. Conversely, when an asset’s price reaches higher highs while the indicator reaches lower highs, this is known as bearish divergence.
Bullish Divergence
Bullish divergence occurs when an asset’s price is making lower lows, but the technical indicator, such as the RSI or MACD, is making higher lows. This suggests that the downward momentum of the trend is waning, and that an upside reversal may be possible. Traders may use this information to identify potential long entry points or to avoid short positions in a weakening downtrend.
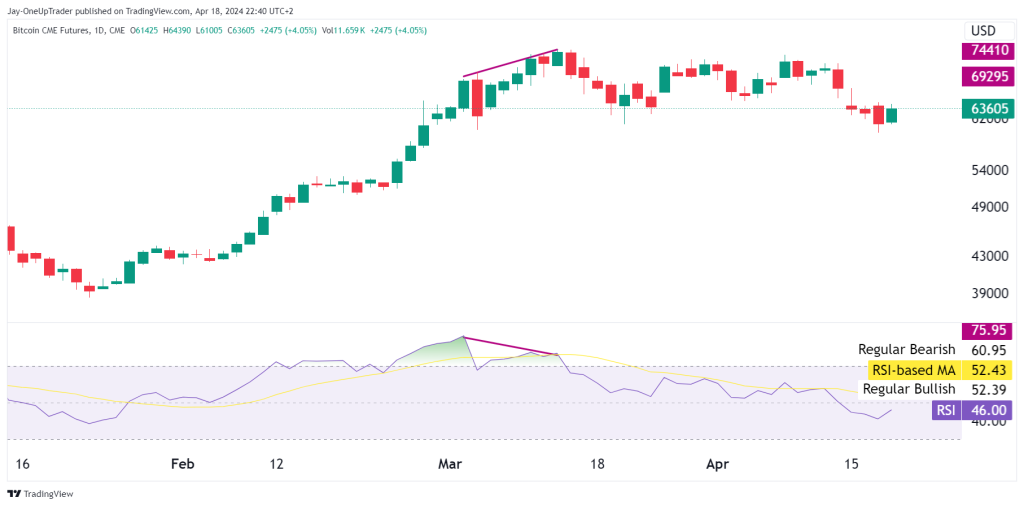
Look at the example below for an example of a clear bearish divergence:
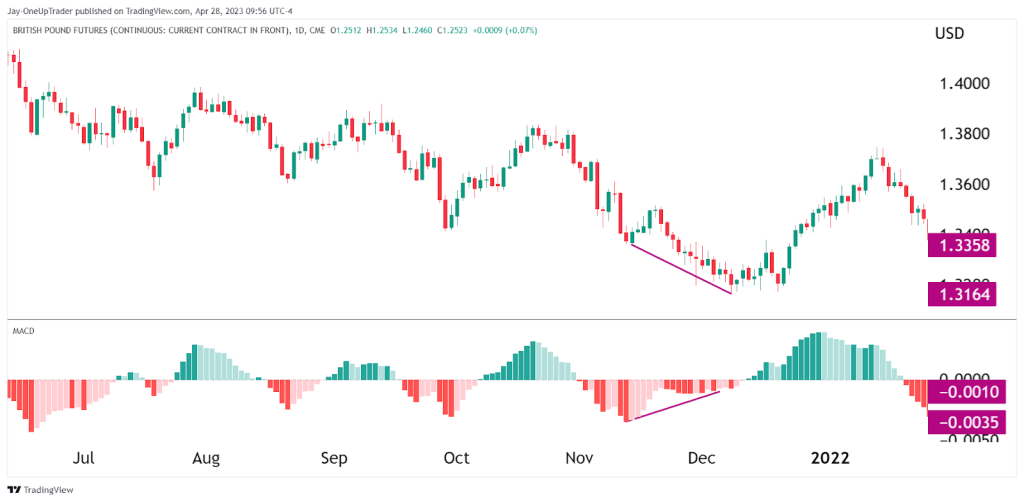
Notice how the price makes a lower low, indicated by the purple line. The MACD does not confirm this price action and makes a higher low. This is a signal that the selling pressure is weakening.
Bearish Divergence
Bearish divergence occurs when an asset’s price is making higher highs, but the technical indicator is making lower highs. This indicates that the uptrend’s momentum is waning, and that a potential downside reversal may be imminent. Traders may use this information to identify potential short entry points or to avoid long positions in a weakening uptrend. Below is an example of bearish divergence this time with the RSI indicator:

RSI Divergence
The Relative Strength Index (RSI) is a popular technical indicator that is often used in conjunction with divergence analysis. RSI bullish divergence occurs when the price is making lower lows, but the RSI is making higher lows. Conversely, RSI bearish divergence occurs when the price is making higher highs, but the RSI is making lower highs.
It’s important to note that divergence is not a standalone trading signal, but rather a tool to be used in conjunction with other technical and fundamental analysis. Traders should always use caution and risk management when incorporating divergence into their trading strategies.
Rules To Follow in Divergence Trading
Price action: The first step is to ensure that the price has formed one of the following patterns: a higher high (HH), lower low (LL), double top, or double bottom. These patterns are essential for identifying potential divergences. Don’t, under any circumstances, look for divergence in a range-bound market. The signals will be false and unreliable. Divergence trading only work in trending markets where there is an obvious direction in the market.
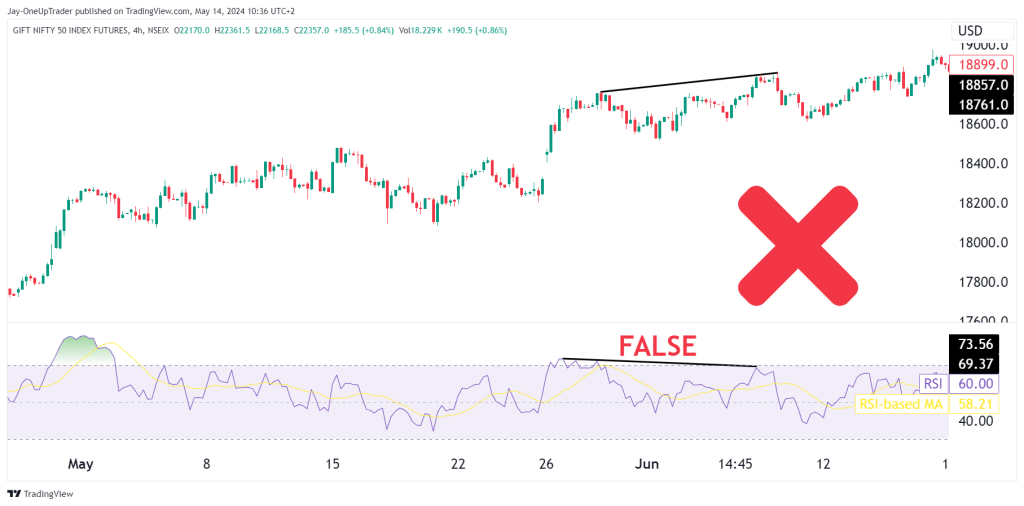
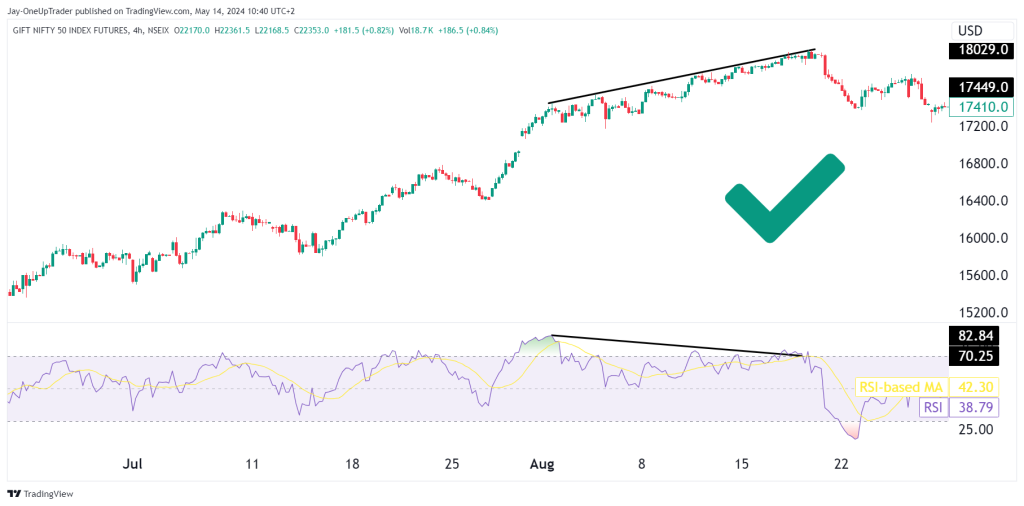
In the above example, it is clear that the price has reached a new high, but the indicator has not. Once we have checked that, we confirm if the price is trending. In the first image, it is not, so we disregard the divergence trading signal, but in the second image, there is a clear uptrend.
Notice too, that once divergence occurs it does not mean a reversal will definitely occur, very often price will just move sideways and consolidate after the divergence signal.
Time frame consideration: Divergence trading signals are generally more accurate on longer time frames (1-hour or longer) due to less market noise. Shorter time frames may produce more frequent but less reliable signals.
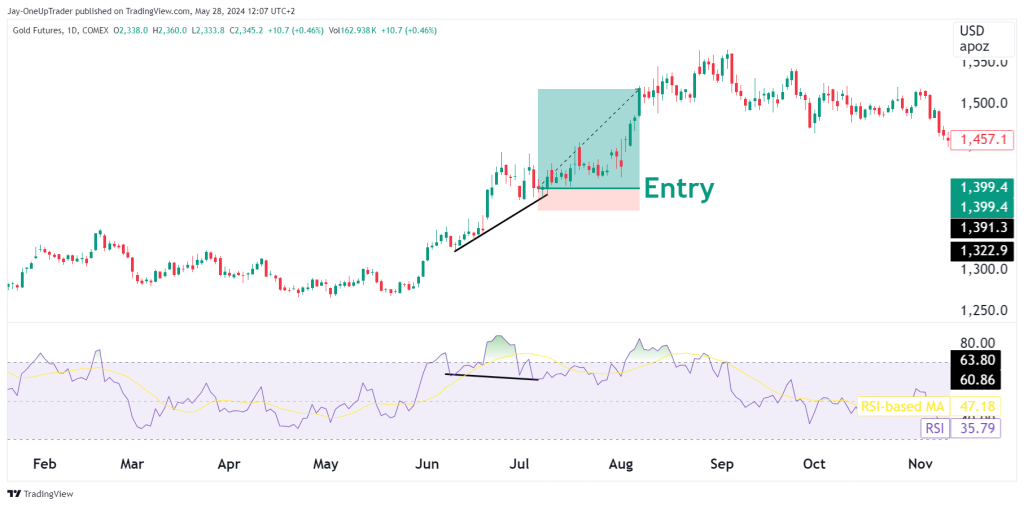
HOW TO TRADE A DIVERGENCE – THE OPTIMAL ENTRY
When it comes to taking trades based on divergence, there are a few keys to keep in mind. One of these is that divergence simply signals a loss of momentum but does not necessarily indicate a complete trend shift. This is something many traders do not learn or understand correctly; they think when they see a bearish divergence that, it’s automatically a signal to take a short position. This is FALSE! You will have a lot of losses this way.
Think of divergence like this: The probability of the uptrend/downtrend continuing in the short term is less. This means to avoid taking longs if you see bearish divergence and avoid taking shorts if you see a bullish divergence.
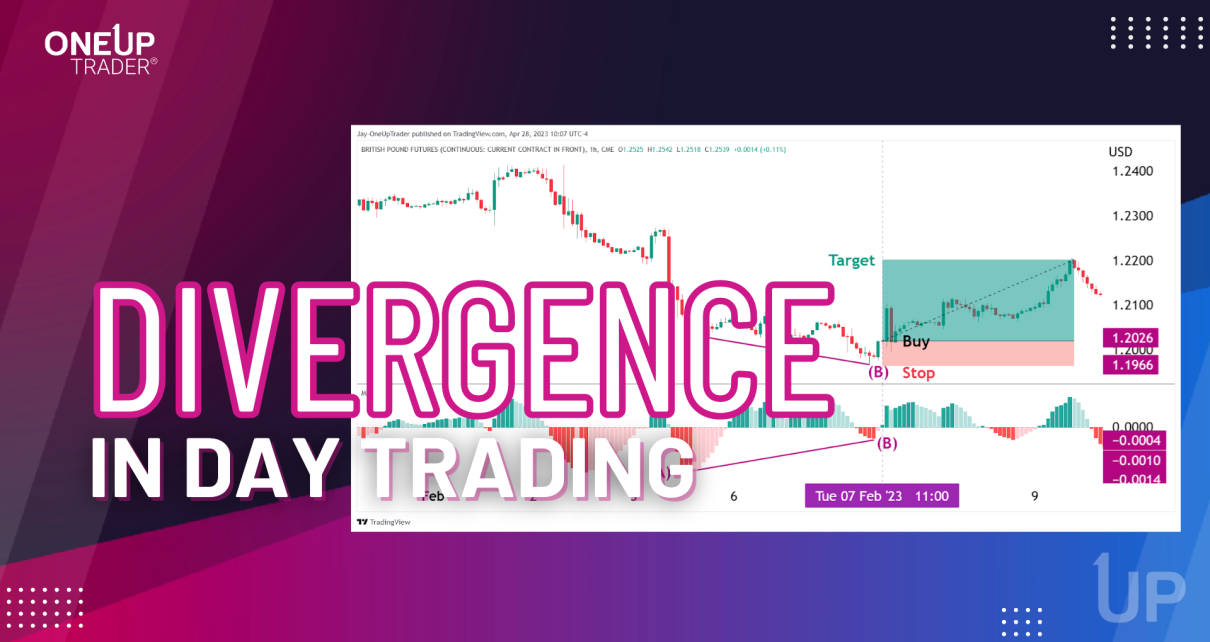
See in the chart below how even after we get a great divergence signal, price doesn’t reverse but sits sideways. If you took a short here, you would likely be in a small loss or at best breakeven.
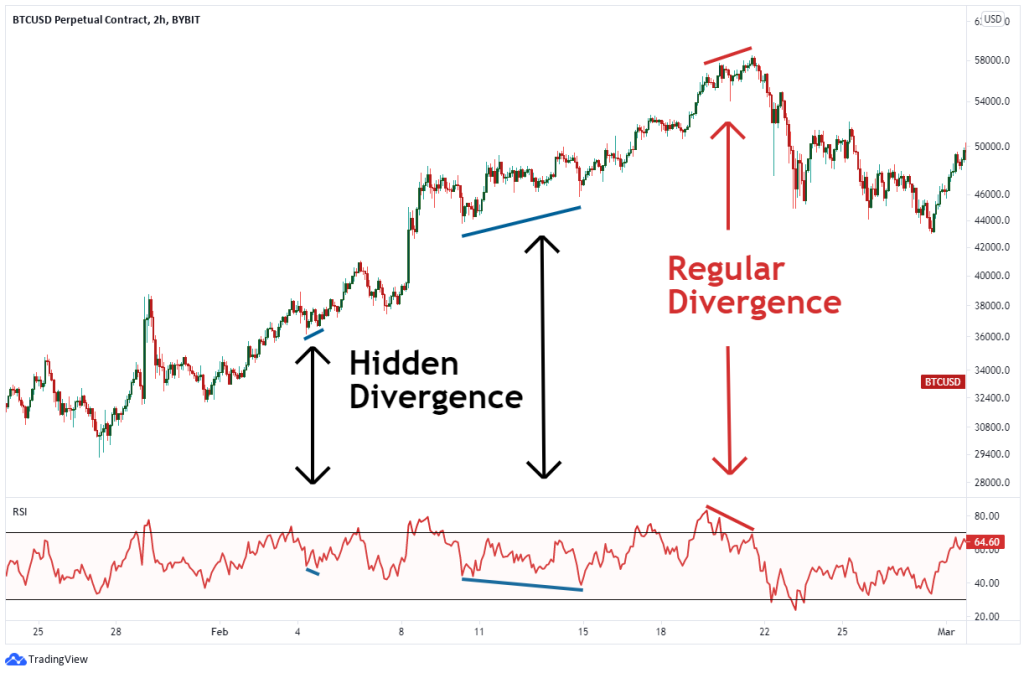
Hidden Divergence
Hidden divergence is used by traders to identify trend continuations. It occurs when the price makes a higher low (in an uptrend) or a lower high (in a downtrend), while an oscillator shows a lower low (in an uptrend) or a higher high (in a downtrend).
Here’s a breakdown of the two types of hidden divergence:
Hidden Bullish Divergence:
- Occurs in an uptrend.
- Price forms a higher low.
- Oscillator forms a lower low.
- Indicates that the underlying strength of the trend is still intact and the price may continue to rise.
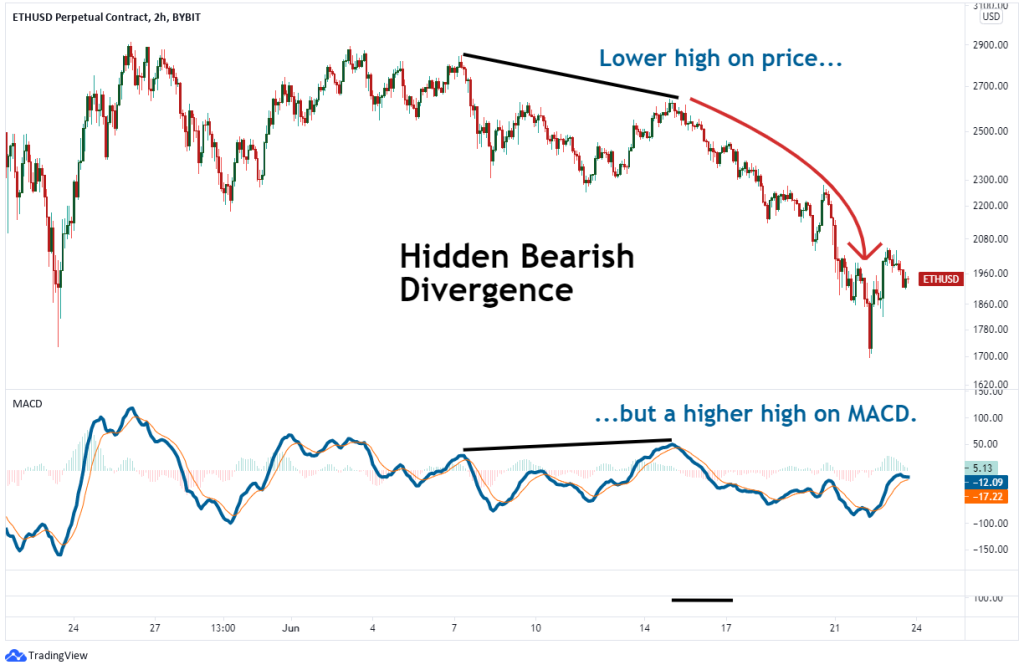
Hidden Bearish Divergence:
- Occurs in a downtrend.
- Price forms a lower high.
- Oscillator forms a higher high.
- Indicates that the underlying weakness of the trend is still intact and the price may continue to fall.
Hidden divergence is used to confirm the strength of an existing trend and to identify potential entry points for trades in the direction of the trend. It is considered a more reliable signal than regular divergence because it aligns with the prevailing trend.
The hidden divergence trading strategy offers several advantages, including the ability to identify trend reversals early, confirm existing trends, provide clear entry and exit signals, and adapt to various timeframes. However, it also comes with risks, such as generating false signals in ranging markets.
How To Trade Hidden Divergence
1. Identify the Trend
- Uptrend: Look for higher highs and higher lows in the price chart.
- Downtrend: Look for lower highs and lower lows in the price chart.
2. Use an Oscillator
Common oscillators used for identifying hidden divergence include:
3. Look for Hidden Divergence
- Hidden Bullish Divergence: In an uptrend, the price forms a higher low, while the oscillator forms a lower low.
4. Confirm the Divergence
- Higher Low in Price (for bullish divergence) and Lower Low in Oscillator.
- Lower High in Price (for bearish divergence) and Higher High in Oscillator.
5. Entry Points
- Hidden Bullish Divergence: Enter a long position when you identify a higher low in the price chart along with a lower low in the oscillator.
