

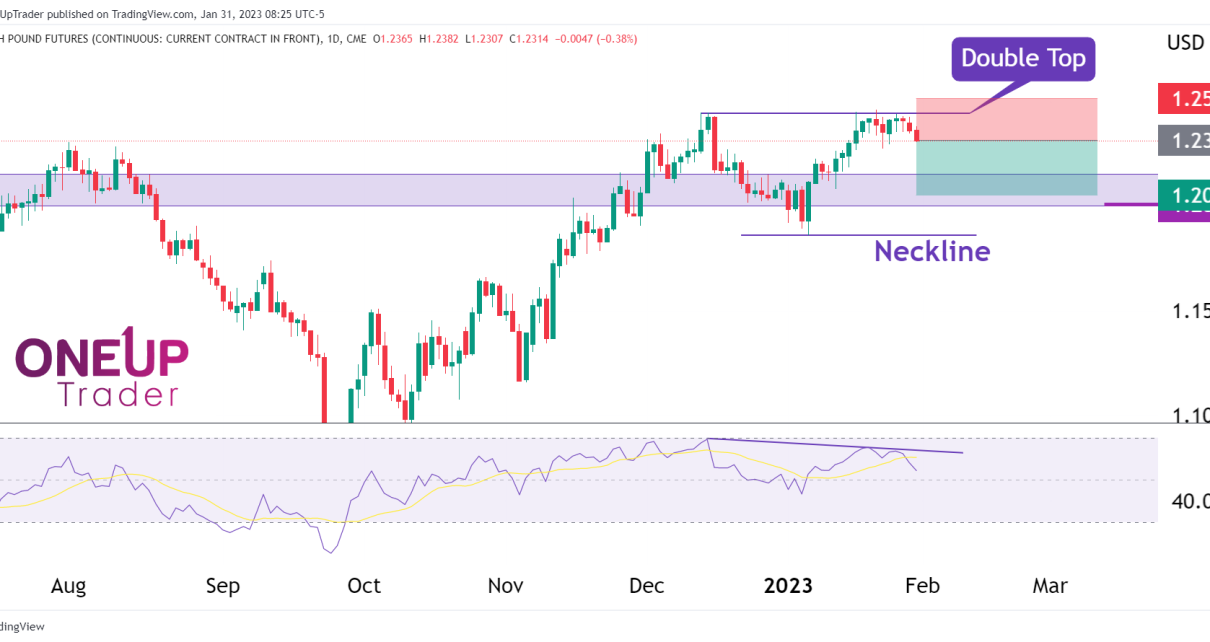
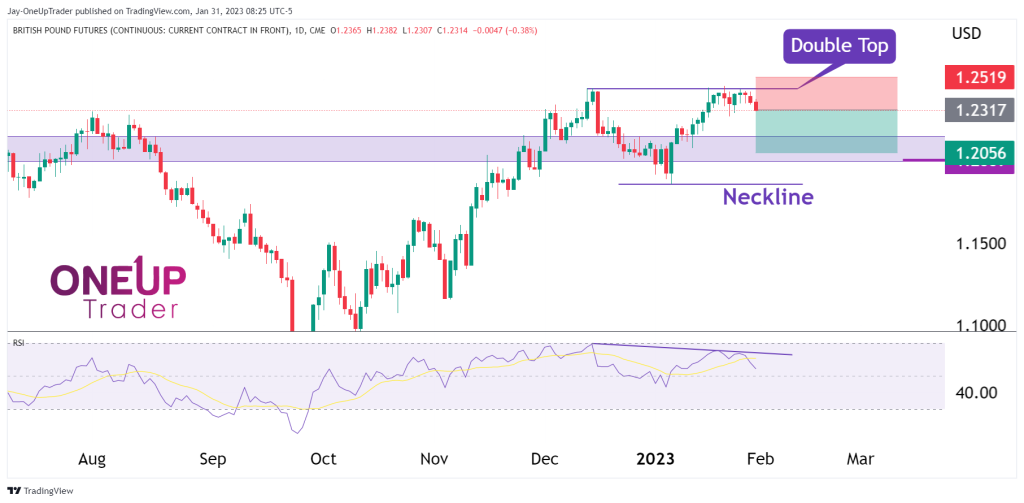
- Double-top formation is the most apparent technical indicator we are focusing on.
- RSI bearish divergence adds some strength to the potential double-bottom.
- Why expectations lead to disappointments in financial markets.
Technical Analysis
The daily chart on 6B is currently forming a double-top pattern. Price is still a way away from the neckline, but traders who wish to take advantage of the early potential of the pattern could short at these prices, setting stop losses above the recent high at around $1.25. Targets at $1.2 are reasonable for now, and if the sterling continues to fall further from there, we could see bears break below the neckline, leading to even further downward pressure. This, however, is too far for us to even consider at this point, especially with the Fed interest rate report later today.
There is some RSI divergence on the daily chart, too, which adds a bit of strength to the bearish case.
Expectations lead to disappointments.
This title must not be viewed in the wrong light since it’s important for traders to have “expectations” of what they think the market price may do. However, we must not have expectations of winning or losing. We must not wish for the trade to work out or hope it will be profitable so we can ‘enjoy’ the rest of our day. Doing this engages the emotional center and is unproductive. There is no need to wish for anything in the markets; once you have taken your well-calculated position, let go of it. It’s entirely out of your control, so stop worrying because you can’t do anything about it.
It’s ideal to have stop losses and profit targets predetermined; this way, we do not constantly have to question whether we should get out or let it run. It’s critical to make trading as simple as possible, and having our executions planned in advance is one way of doing that.

