

Recap from August 11 Analysis
In the previous analysis, we highlighted:
- NQ was rallying strongly, trading above 23,700, with bulls targeting a test of the 24,000 level.
- The structure was clearly bullish, but we cautioned about the risk of the market overextending and the potential for pullbacks if momentum cooled.
- Support zones were defined around 22,700 (short-term) and 21,200–21,500 (medium-term).
Technical Analysis
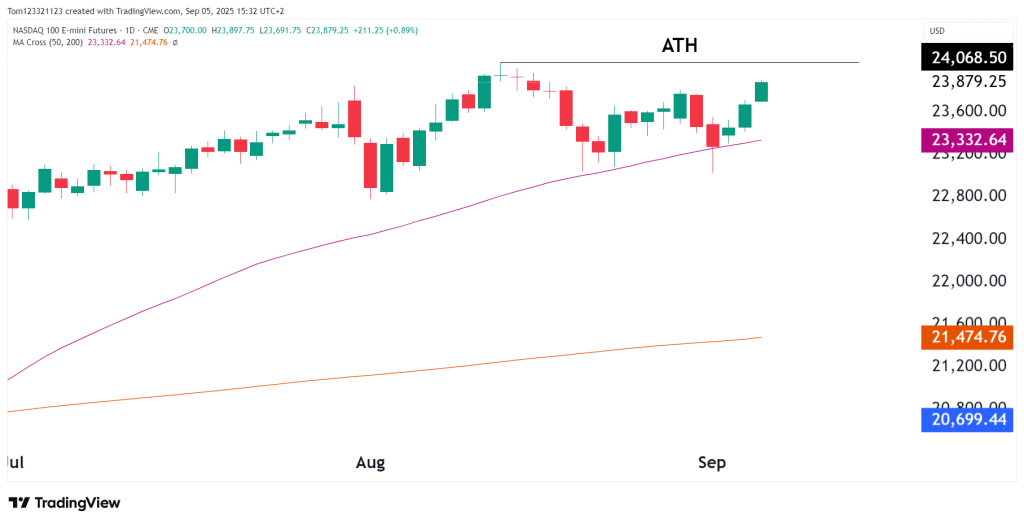
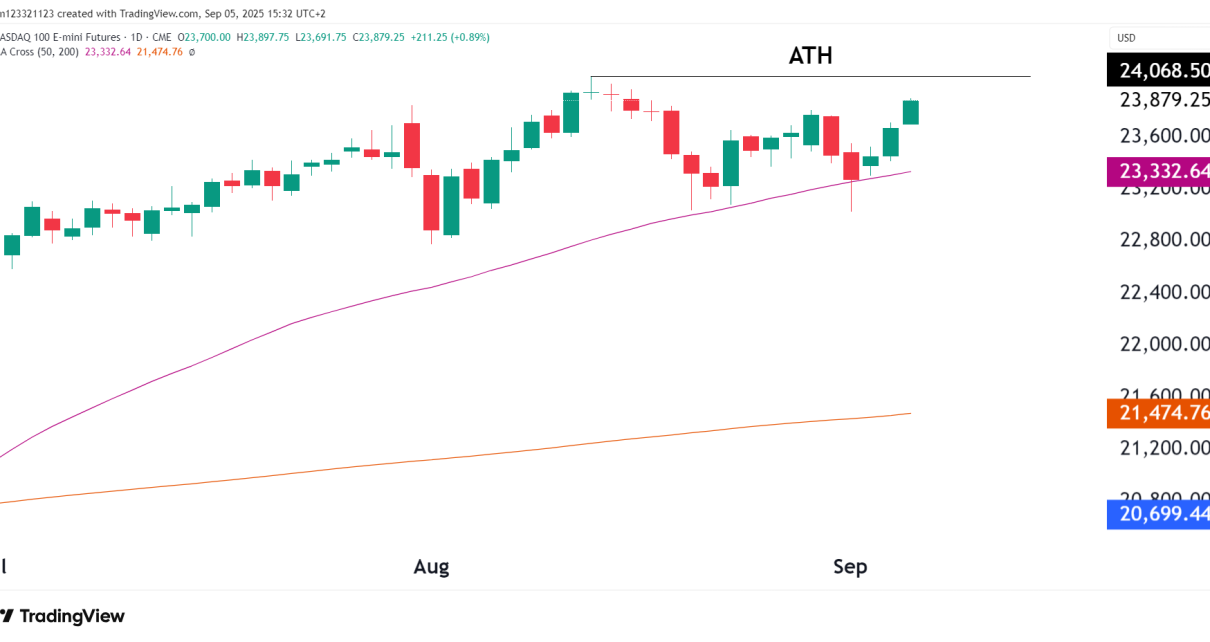
NQ is back near its all-time high at 24,068, after a short consolidation phase in mid-August. The market has also had three bullish candles in a row, confirming the strength of the bullish momentum. The 50-day SMA is also holding support well, and price has bounced each time it has been tested since the 20th of August.
Context vs Other Indices
Similar to ES and YM, NQ is pressing against its highs, but tech is still leading. Russell (RTY) has also been rebounding, but NQ is still the index closest to new highs. Normally, when small caps rebound, it signals that investors are regaining confidence in smaller, domestically focused companies, often seen as a measure of risk appetite.
Key Technical Levels
| Level | Type | Commentary |
|---|---|---|
| 24,068–24,100 | Resistance / ATH | Breakout level; sellers active here |
| 23,700 | Near-term Support | Short-term pivot zone |
| 23,333 | 50-day MA | Dynamic support, held in August |
| 22,700 | Secondary Support | Stronger base below |
Probability Table
| Scenario | Estimated Probability | Notes |
|---|---|---|
| Breakout to 24,200–24,500 | 50% | Strong momentum, Bulls must push through ATH |
| Sideways between 23,700–24,000 | 30% | Market digests gains, sellers step back in |
| Pullback toward 23,300 | 20% | Only if breakout attempt fails with rejection |
Trade Ideas
Bullish Breakout Play
- Entry: Buy breakout above 24,100
- Target: 24,400–24,500
- Stop: Below 23,850
Rejection Short Play
- Entry: Short if rejection candle forms at ATH (~24,000–24,100)
- Target: 23,333 (50-day MA)
- Stop: Above 24,200
Ending Off
Since the August 11th analysis, NQ has climbed steadily back toward its ATH, showing resilience after testing support near the 50-day MA. Bulls remain in control, but the 24,000–24,100 zone is critical.
- A clean breakout could extend the rally into uncharted territory toward 24,400–24,500.
- A failure at resistance could trigger a pullback toward 23,300.
For now, the Nasdaq remains the strongest of the US indices, and momentum still favors the bulls.