Introduction:
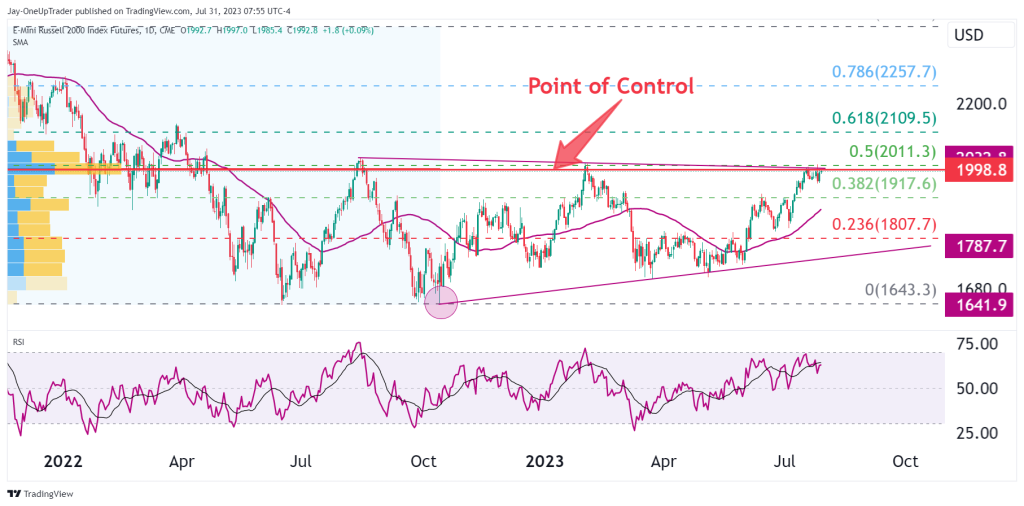
RTY has surged 22% since its lows in October last year, showcasing the strong bullish momentum. The upward-sloping 50-day moving average and an RSI of 62 reinforce equities’ optimistic outlook. Currently trading on the point of control line for the volume profile indicator, RTY faces a resistance zone just above the 2000 level, coinciding with the 50% Fibonacci retracement level. A large converging chart pattern, which spans from August of last year to the present, still is the most dominant feature on the RTY chart.
Technical Analysis:
Like most indices, the Russel has been in an uptrend, climbing 22% since its lows in October last year, reflecting bullish market sentiment. The 50-day moving average (MA) trending upwards indicates robust momentum, while the RSI at 62 suggests there is still some space for the price to move higher since it is not overbought in a range-bound market. The most interesting part is that price is currently trading on the point of control line for the volume profile indicator, which is the level at which there is the highest amount of trading activity and liquidity. Because of this, it can act like a magnet, attracting the price. However, RTY faces a significant resistance zone just above the 2000 level, aligning with the 50% Fibonacci retracement level.
Trading Opportunity:
It is my opinion that the RTY doesn’t have many opportunities at the moment. Since we are at a resistance zone, the point of control line, and the 50% Fibonacci retracement, I see price struggling to move higher in the near term. Short positions in normal cases could be taken here but since most equities markets are rallying so hard, it would be a risky trade to take.