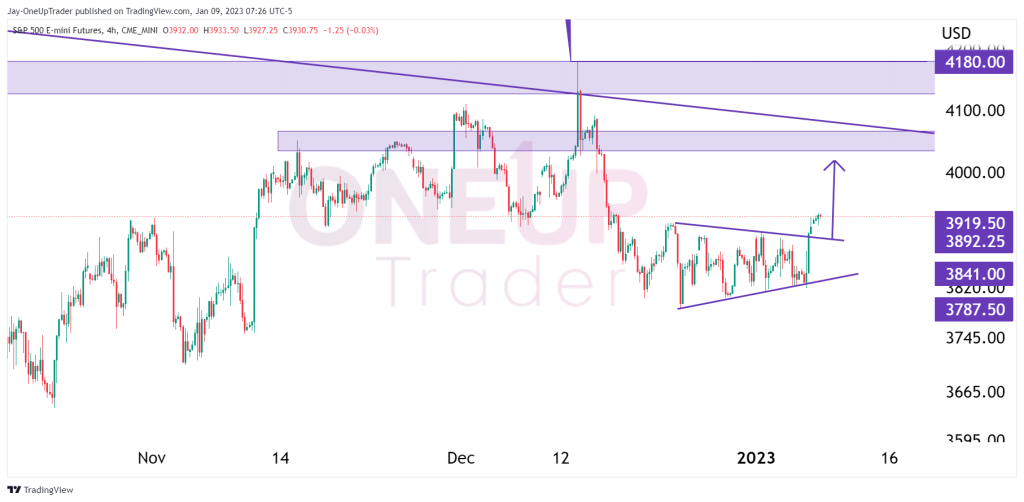
- ES has broken out of a minor consolidation zone.
- Analyzing a few ways we can profit from current market conditions.
- Targets for bulls to aim for if the bullish momentum continues.
Breaking Out
January 6th session saw a big jump in the S&P 500 as ES closed the first week of the year up 1.8%. This ques up a decent breakout as an opportunity for traders to profit in the next potential leg up.
The small consolidation zone lasted about 3 weeks, with price stuck between $3,809 and $3,896.
With Friday’s bullish engulfer, ES has closed above the zone’s high, which presents us with some potential setups.
Analzing The Consolidation Zone
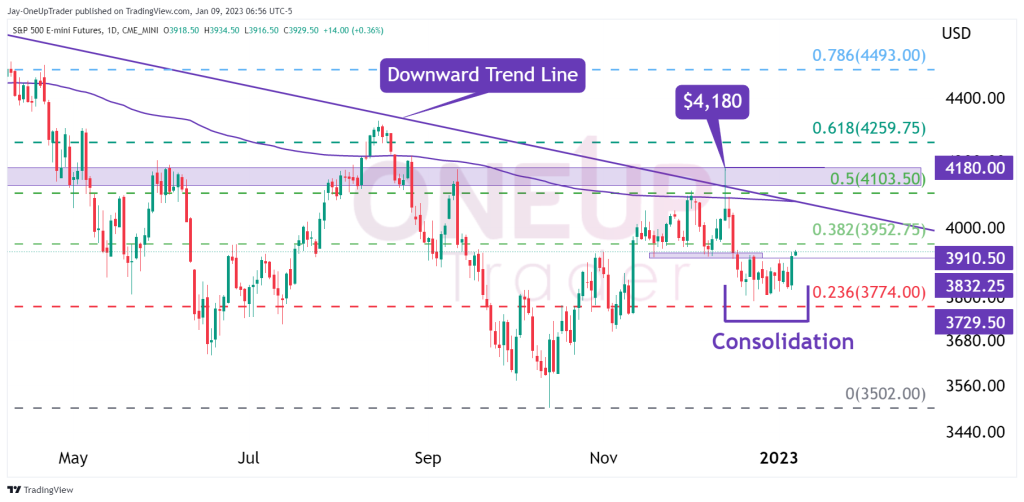
Since the consolidation zone lasted only a short time, we cannot be sure of the current break out. Currently, the only reason we are seeing a rally in ES is because of the jobs numbers that we saw yesterday, and there is nothing technical on the chart backing Friday’s bullish move. Bearing this in mind, we can still look at potential long opportunities because we have a defined stop loss below the consolidation zone at $3,774. This is also the 0.236 Fibonacci level which could lead to added support; however, because this is a long opportunity, any stops would be placed there because it would indicate that the long entry taken at the breakout was not valid.
Targets
If the breakout continues with its bullish momentum, we could likely see ES rally toward the downward trend line in the image above. Targets of $4,000 are very reasonable for bulls right now; we need to see price remain above 3892.25 for that to be a possibility, however.