- The recent price run-up seems to be slowing down.
- Resistance has been found at the 78% Fib level.
- Expecting lower prices for NQ with a possible target of $11,068.50.
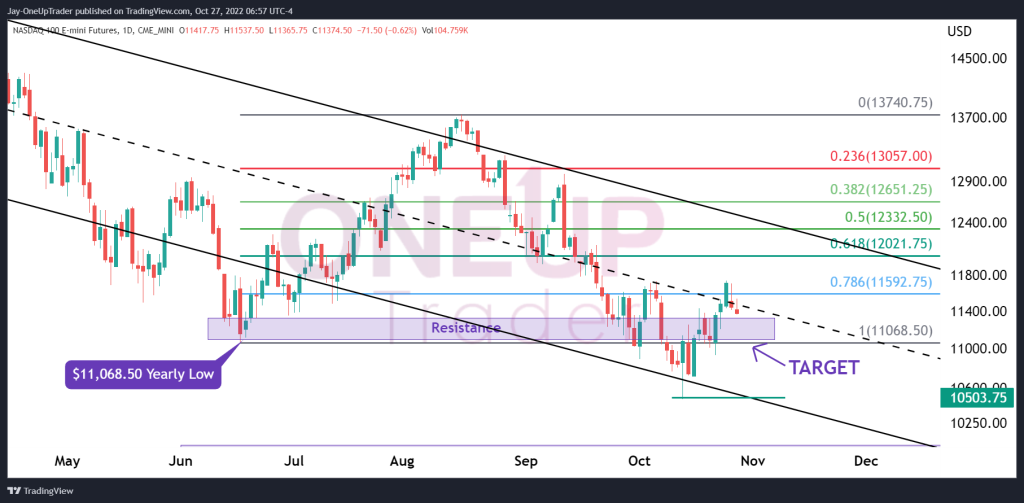
Daily Chart
The Fibonacci retracements give us a possible scenario where the price could test the 100% line at $11,068.50. Looking at the recent bounce off the yearly lows around $11,068.50, it does not look convincing to move higher, which is why we are reluctant to shift our sentiment to Bullish yet.
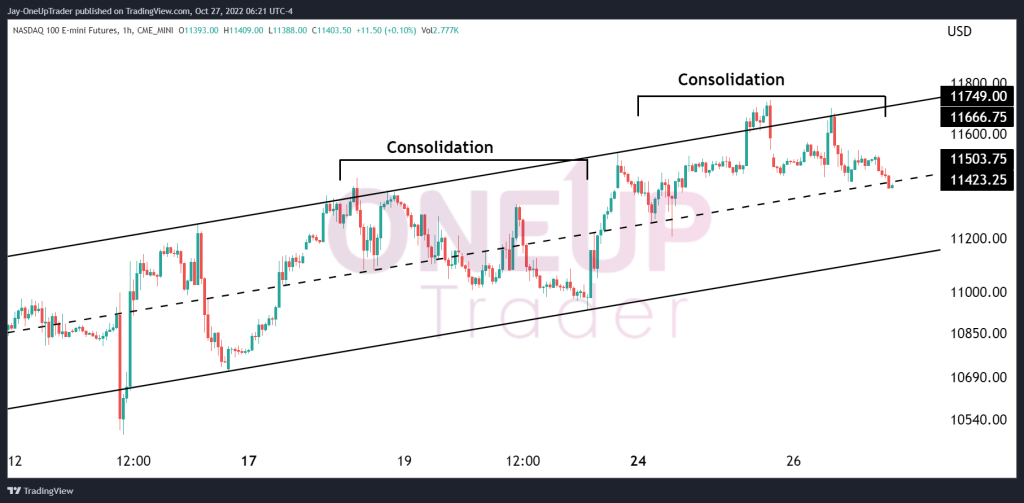
1 Hourly Chart
Shifting our attention to a clean 1 hourly chart, we see a very choppy price action. This suggests that there are still many sellers within the market at the moment. Ideally, we would like to see stronger momentum, but we see opportunities for the bears because the price moves are so lackluster. The over-extended consolidation periods also tell us that buy pressure does not appear strong enough to continue. However, we must always think in probabilities, so with that being said, the probabilities are in the Bears’ favor.
Summary
The market is ‘confused,’ and Fundamentals are playing a massive role in the indecision. We are not impressed with the recent rally off the lows and see more potential for a downside move from here to targets of $11,068.50.