


- Volume: Wyckoff volume has slightly decreased on average.
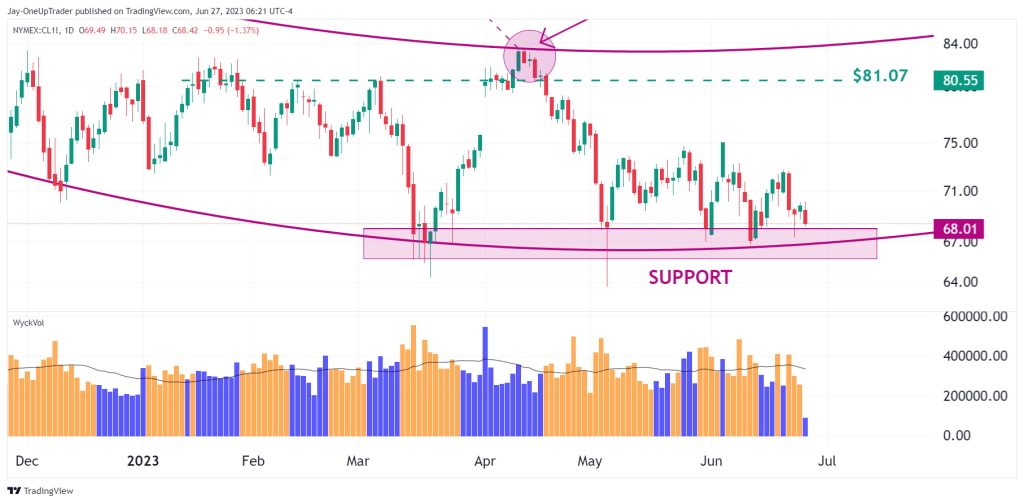
- Support Zone: A strong support zone exists at $68.01, attracting buyers and demonstrating high demand.
- Parabolic Curve: The parabolic curve observed throughout the year remains a prominent chart formation.
- Bullish and Bearish cases.
Technical analysis
Volume: The Wyckoff volume has dipped slightly, with te average at 334,780 contracts traded per day, down from 381,900 contracts per day back in April.
Support Zone: There is a support zone at $68.01 which continues to attract buyers. There is high demand at this price level, and it will take a big effort from the bears to push the price below this point.
Parabolic Curve: The parabolic curve that we have been tracking for the majority of the year in CL continues to be a strong formation on the chart. It adds to the support as Oil bounces within the parabolic channel.
Bear and Bull Cases
The bullish case is that demand continues into July at the support zone mentioned above. Eventually, bulls take full control, and price rallies to the upper zone at $81.07. The weaker Dollar would assist the bullish case as we approach the second half of the year.
The bearish case would require us to see Oil drop below $64. If CL dropped significantly below this, it would be unchartered waters, and the market could fall rapidly. This is the more unlikely of the two cases; remember to always think in probabilities.