- Analyzing the multi-year level back from 2016.
- Fibonacci retracements, RSI, and a rolling top show further downside for 6E.
- A look at Bullish and Bearish Scenarios.
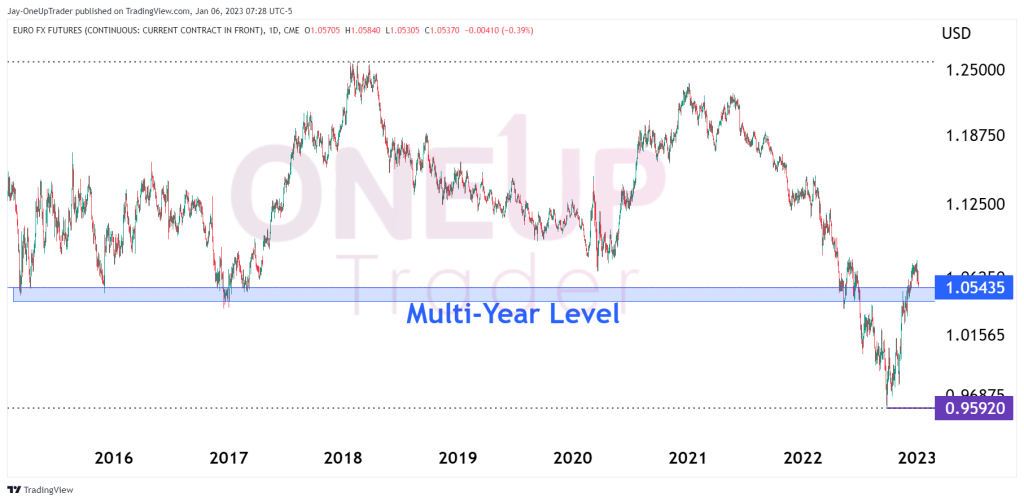
Zooming Out
The multi-year support & resistance level for 6E is $1.0543. This level has been tested multiple times since 2016. The market price is sitting on this level at the time of writing as the Dollar begins to gain significant strength over the Euro for the first time in over two months. This level should be a significant barrier for bears on the 6E chart to push through.
However, the current fiscal policy in the US makes it feel like the Dollar has infinite capabilities of rallying.
It will be important to monitor this level; if we see a clear move right through it with very little support, it signals that 6E is on its way toward $1.015.
Indicators That Point Toward Further Declines In The Euro
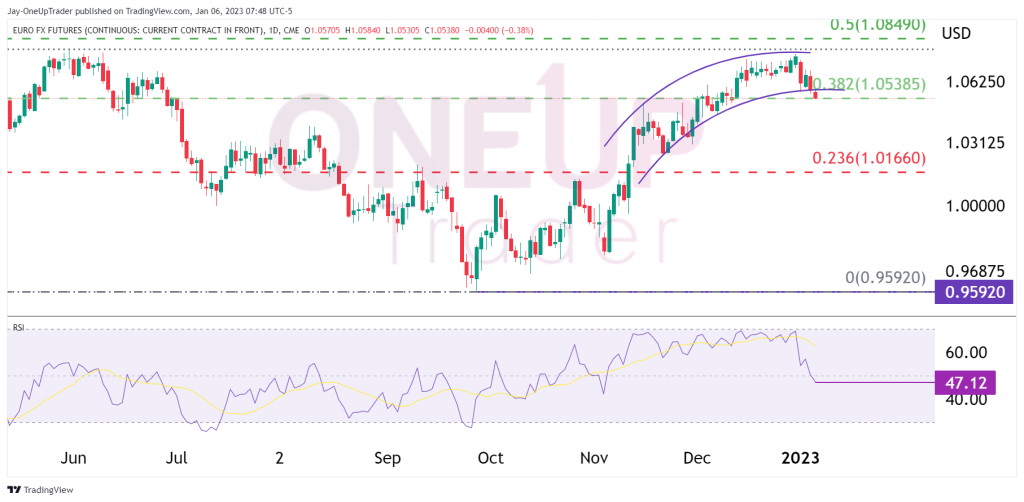
Fibonacci Retracements & Rolling Top: The 0.382 Fib level is currently being tested after price had formed a rolling over top formation. It’s better not to chase the market, but since the rolling over is forming, it will more than likely continue to accelerate as time goes on until a significant move has occurred. We could see 6E drop to 1.016 in the coming days or weeks.
RSI: The Relative Strength Index is currently sitting at 47.12 and has just crossed below the 50 line indicating a strong bearish momentum. If it continues, we could see the RSI reach oversold territory, and only then would we consider closing short positions.
Possible Scenarios
Bullish Case: If the buying pressure at the Fib 0.382 level is high, we could see 6E rally to test the recent highs at 1.075. The rally may not have to go that high either; there is a likely chance of some sideways action for a few days before the trend continues downward. However, this would be fighting the Fed, which is never a good idea.
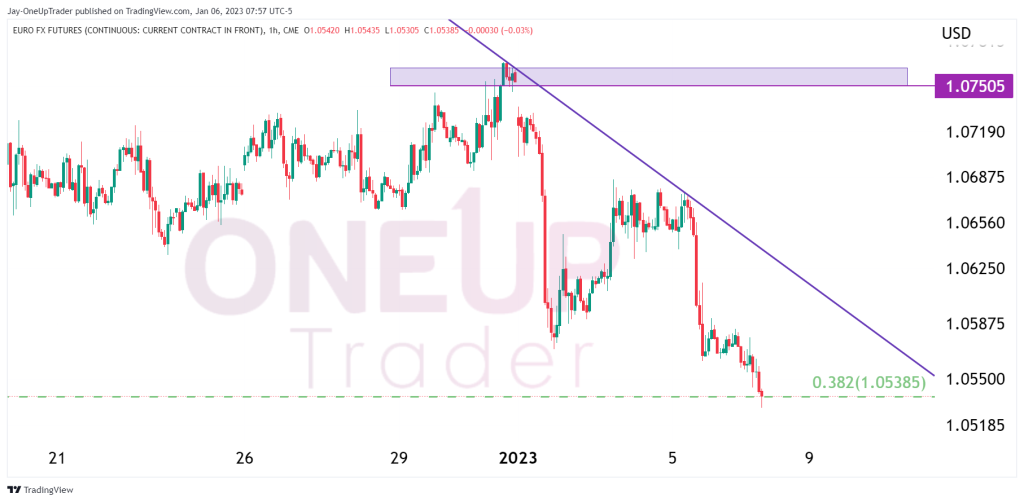
Bearish Case: We could see the selling pressure continuing with very little to no retracements as bears target 1.016. A small downtrend line is shown in the image below that traders could short from if they prefer instead of chasing the market down.