


- Discover how to profit from the current rally in crude oil prices driven by a weak dollar.
- RSI, 1-2-3 reversal pattern, Symmetrical Triangle, and pivot points all point toward bullish momentum.
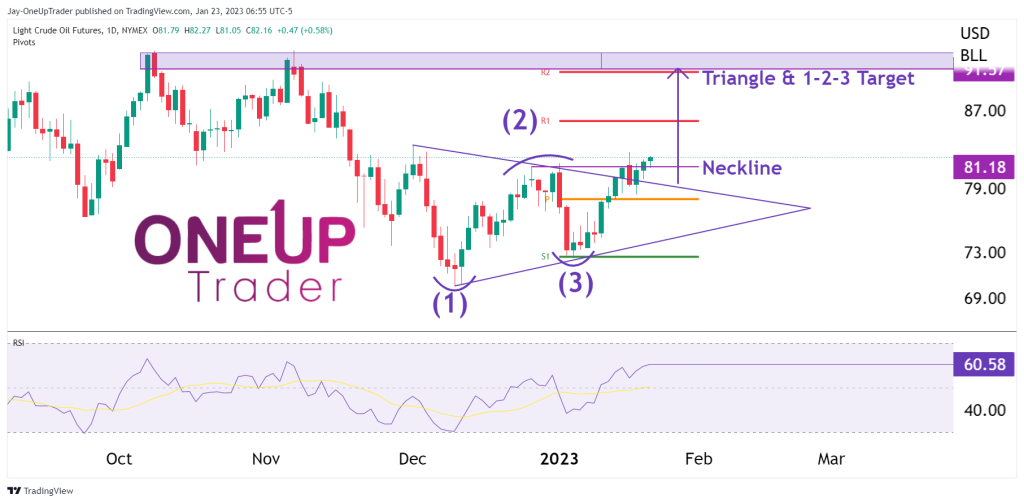
- Trading chart for us to visualize the bullish targets and price momentum.
The driving force behind this rally
Undoubtedly, the driving force behind the CL rally is the weak Dollar. This has led crude to rally 13% in two weeks. The fundamentals are still pointing toward a weaker Dollar and more expensive oil, so the question is, what can we do to profit from this as traders?
Luckily some strong technicals on the CL chart can help guide us toward making the best probability trades going forward.
Probabilites signal move higher
Relative Strength Index (RSI): The daily chart RSI is printing 60.58, has recently crossed back over the 50 line, and seems to be heading toward the 70 line, which signals further bullish momentum from current prices.
1-2-3 Reversal pattern: There is a 1-2-3 reversal pattern formed on the daily chart. The neckline is at $81.18, and the current price of oil is $82. As long as the neckline holds as support, the pattern will still be valid, and the target for the completion of the system is $91.57.
Symmetrical Triangle Pattern: Price has broken out of the top side of the symmetrical pattern analyzed from last week. This pattern is also giving bullish targets of around $91, just like the 1-2-3 reversal. If the support holds at $81, then this pattern remains valid.
Pivot Points: The R2 pivot point is right at the targets mentioned above and is something we should be mindful of as each day passes and CL bulls set themselves targets to aim for.
Summary
Over the past two weeks, the weak dollar has led to a 13% rally in crude oil prices. Some strong technicals on the crude oil chart can help guide us in making the best probability trades going forward. The technical indicators discussed all point toward bullish price action in the next few days and possibly weeks. Overall, as long as support holds at $81, these patterns remain valid, and traders should be mindful of the targets as each day passes.

