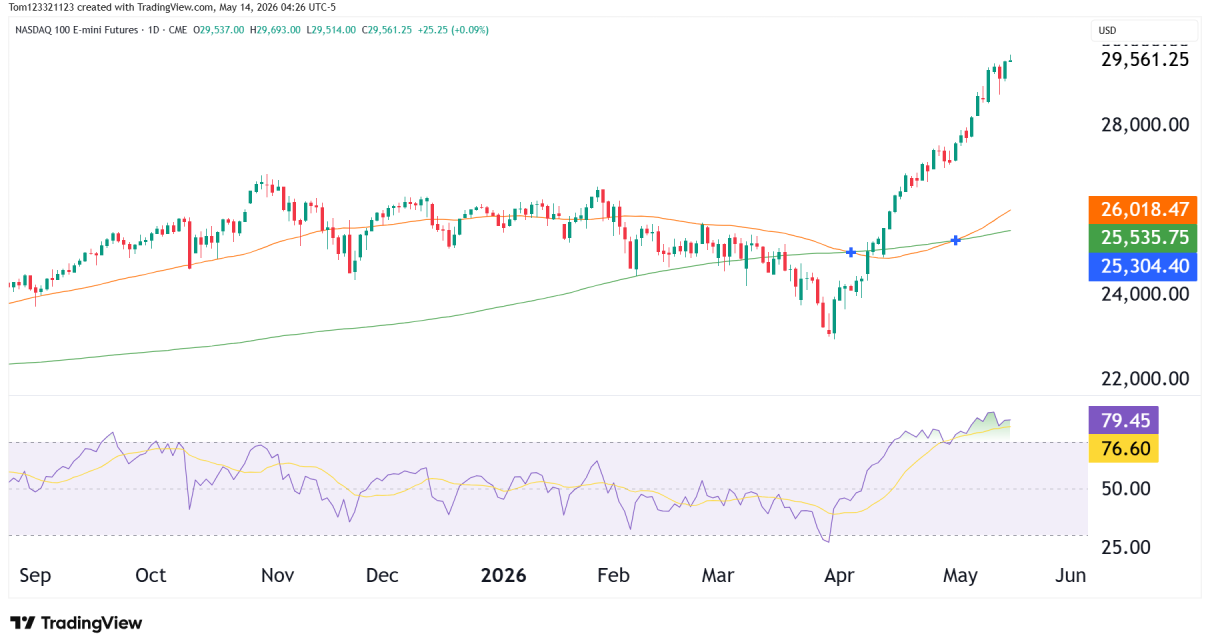
Fundamental Analysis

Equities Rally as S&P 500 Hits Another Record High

On Monday, equities rallied as the S&P 500 set another record high, driven by gains in tech stocks. Meanwhile, investors awaited corporate reports for insights into this year’s profit outlook. Additionally, on Friday, the S&P 500 confirmed its bull market status since its low on October 12.  Top tech companies like Microsoft and Apple will Read More…

Crude Oil Futures
Technical Analysis

Crude Oil Futures (CL) quickly turning bullish

Weekly Chart Analysis: Looking at the weekly chart, we observe that Light Crude Oil Futures have recently bounced off a consolidation zone around the $74.88 level, indicating a potential bullish breakout. Last week’s candlestick closed above this zone, and this week’s candle is turning green already. A sustained hold above $74.00 could see us targeting Read More…

a man checking the type of stock orders on his laptop
Fundamental Analysis

Currency Futures End Mixed in Response to Friday’s Economic Reports

Currency futures were mixed on Friday amid varied economic reports. At the same time, the dollar ended its recent winning streak. Still, it was a bullish week for the dollar because Fed rate cut bets went down with more positive data and hawkish remarks from Fed officials.  US consumer sentiment (Source: University of Michigan) The Read More…

E-mini S&P 500 (ES) futures
Technical Analysis

Bulls in full control as S&P 500 (ES) Surges

Weekly Chart Analysis: The price of ES has made a significant move by closing above the all-time high (ATH), which suggests a strong bullish bias. We see a clear break above the previous resistance level, which bulls want to see serve as support in any potential retest. If you’re looking for a bullish confirmation of Read More…

Trading Tips

Relative Strength Index (RSI) Indicator Explained

Introduction As a trader, having the right indicators in your toolbox can mean the difference between successful trades and costly mistakes. One of the most powerful and versatile tools available is the relative strength index (RSI indicator). Virtually every trader knows about the RSI, but are you using it to its full potential? In this Read More…

Technical Analysis

Gold futures (GC) MACD bearish, but POC bullish

Weekly Chart The weekly chart shows how significant the false break has been in GC with bulls still unable to push through. The recent ‘Failed Attempt’ to break above this level is beginning to show signs of exhaustion from the bulls. Immediate support is seen at the rising trendline, currently near the 1974.4 mark. A Read More…