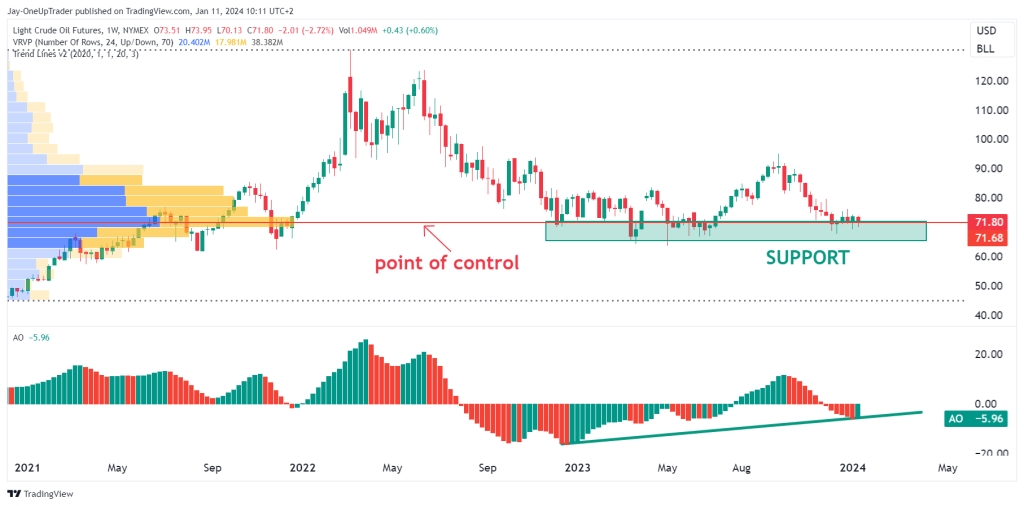
Weekly Chart
The weekly chart reveals a battle at a critical level for crude oil futures. A well-defined support zone at $71.50-$72.00 comes into focus, clearly marked by previous consolidation and the volume profile ‘point of control.’ This level represents a pivotal battleground between bulls and bears because it tells us that this is the level at which the most activity has taken place. Basically, the buying and selling is at maximum capacity.
A break below support signals waning bullish momentum and opens the door to further declines to a possible $40 level. However, if dip-buyers emerge aggressively enough, they can defend support, paving the way for a potential rebound to $90.
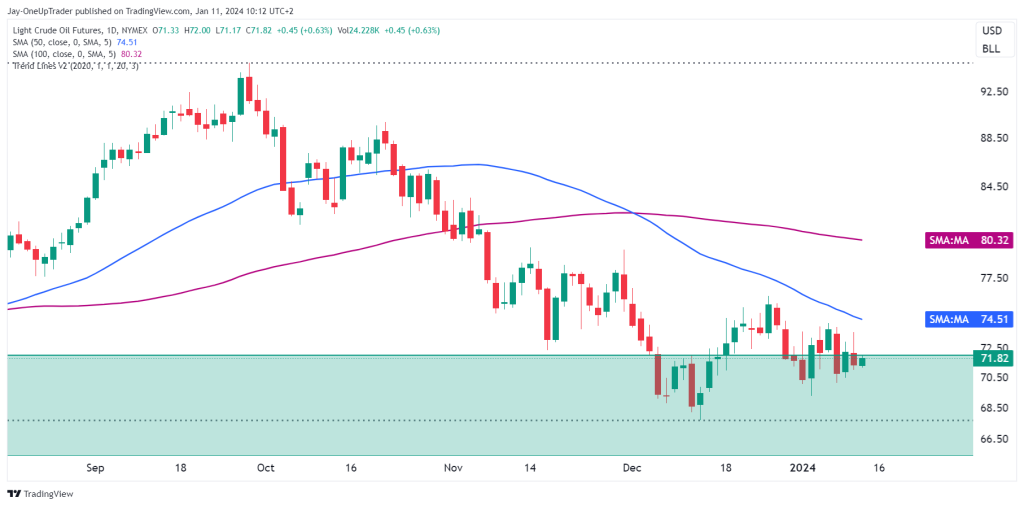
Daily Chart
Drilling down to the daily time frame, the 50-day simple moving average at $74.51 and 100-day SMA at $80.32 are bearish. Because moving averages are lagging indicators, though, we shouldn’t immediately think it’s a short trade. With prices oscillating below the 50-day SMA, the near-term posture appears neutral-to-bearish. A decisive daily close above the 50-day SMA would offer an initial bullish signal, suggesting the medium term may be turning. We would likely see a period of consolidation before that happens though.
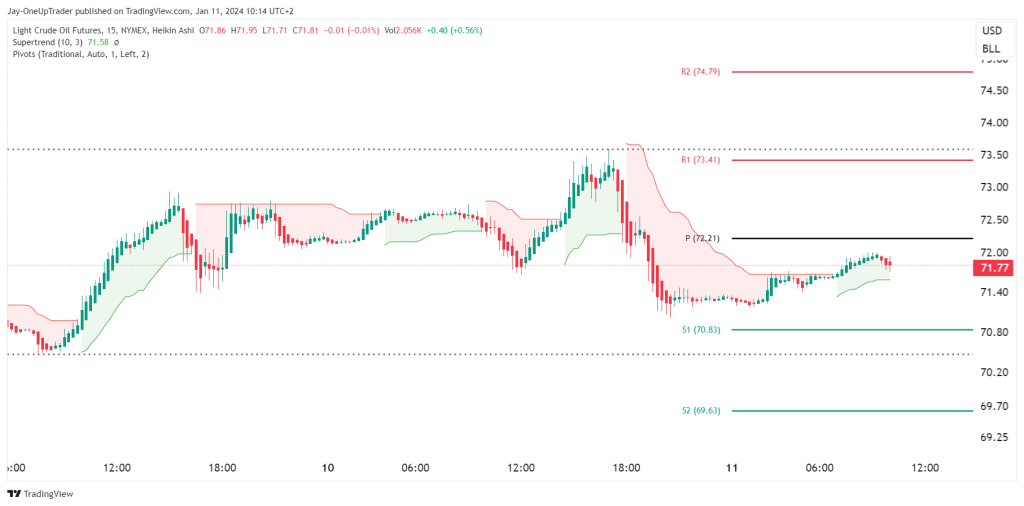
15 Min Chart
Pivot points show key support (S1 at 70.83 USD) and resistance (R1 at 73.41 USD) levels. The price is currently hovering between the main pivot point and the first resistance level.
15 Min Rating
- Rating: Bullish 📈
- Strength: 60%
This is a cautious bullish outlook. The market sentiment could turn bearish if the price fails to break through the R1 level which could lead to the price dropping below the pivot or further down to the support levels.
For trading:
- Short-term, we should watch for a potential test of the R1 level, considering taking profits or setting a tight stop loss to protect against a possible reversal.