

The engulfing candlestick pattern signals potential trend reversals. And since candlesticks patterns are not laggy, you have a higher probability of catching the onset of a trend. Throughout this guide, we’ve discussed how you can identify bullish and bearish engulfing candlestick patterns and how you can use them to trade market reversals.
What is the Engulfing Candlestick Pattern?
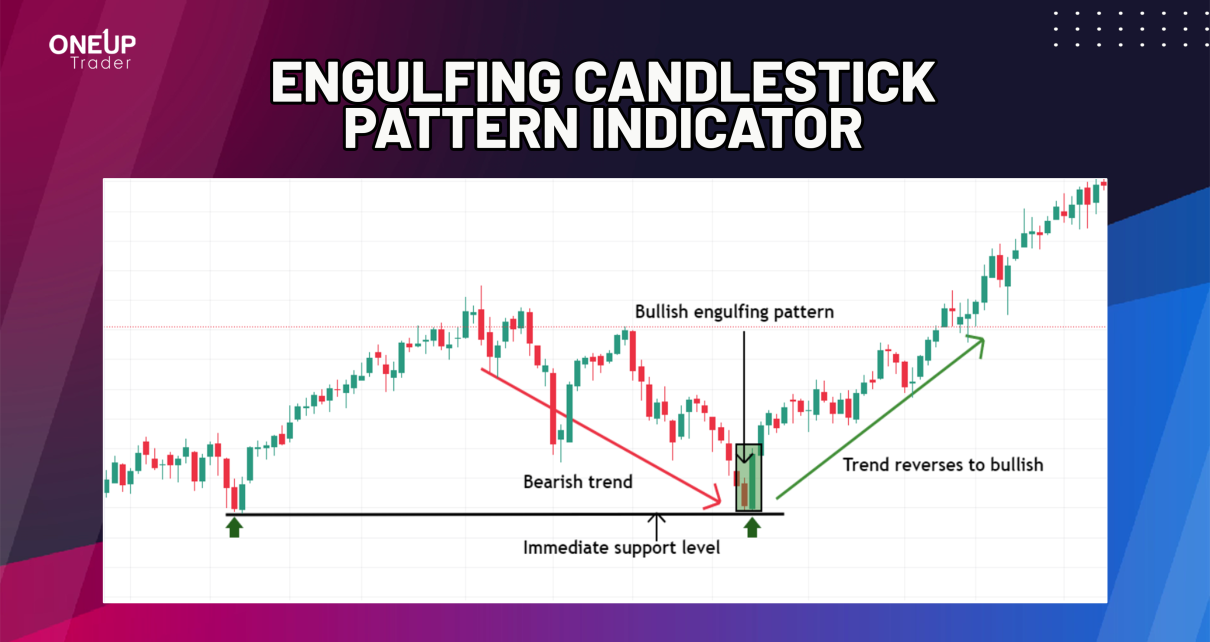
The engulfing candlestick pattern is a trend reversal pattern comprising two candlesticks. It gets its name from the fact that the second candlestick entirely overshadows the first candlestick in the pattern. Depending on the prevailing trend, this double candlestick pattern can either be bullish engulfing or bearish engulfing.
Bullish Engulfing Candlestick Pattern
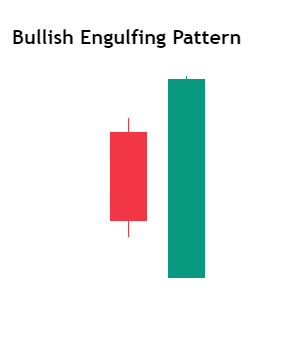
A bullish engulfing candlestick pattern is a bullish reversal candlestick pattern. That means when it forms, there’s a high possibility that the current downtrend will reverse into an uptrend. It’s usually formed towards the end of a bearish trend, with a relatively smaller bearish (red) candle preceding a larger bullish candle (green), which completely covers it.
Here’s how to identify a bullish engulfing candlestick pattern:
- There must be a clear downtrend.
- The first candle in the pattern, towards the end of the trend, should be considerably smaller. It indicates the decline in the selling power – the candle’s open and close should be within the body of the next candle.
- The next candle must be bullish. Ideally, there should be a gap between the engulfing candle’s opening and the preceding candle’s closing. This shows that the bearish trend is waning since sellers couldn’t push the price further.
- The probability of a bullish reversal is higher if the engulfing candle has no upper wick. This implies that the bulls are in control and have progressively pushed the price higher.
- In the best-case scenario, the bullish candle should cover at least three other candles preceding the pattern. The longer it is, the stronger the bullish reversal is expected to be.
Bearish Engulfing Candlestick Pattern
The bearish engulfing candlestick pattern is a bearish reversal candlestick pattern. That means there’s a high possibility that the current bullish will reverse into a bearish one when this pattern forms. It’s the opposite of the bullish engulfing candlestick pattern.
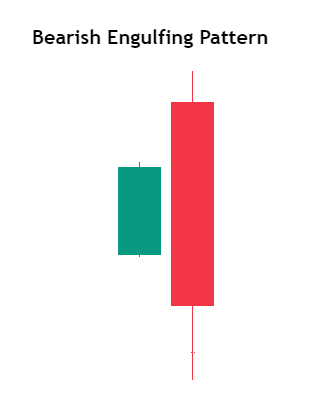
It provides the best signal for a bearish reversal when it forms toward the end of an uptrend, indicating the onset of bears in the market. The bearish engulfing pattern consists of a relatively smaller bullish (green) candle preceding a larger bearish candle (red), which completely covers it.
Here’s how to identify a bearish engulfing candlestick pattern:
- There must be a clear uptrend.
- The first candle in the pattern, towards the end of the bullish trend, should be green and considerably smaller. The smaller candle shows the decline in buying power – the open and close should be within the body of the next candle.
- The next candle must be bearish. Ideally, there should be a gap between the opening of the engulfing candle and the closing of the preceding candle – it should open above the close of the preceding candle. This indicates that the bullish trend is waning since buyers couldn’t push the price further up.
- The probability of a bearish reversal is higher if the bearish engulfing candle has no bottom wick. This implies that the bears are in control and have progressively pushed the price down.
- In a best-case scenario, the bearish engulfing candle should close below at least three other candles preceding the pattern. The longer it is, the stronger the bearish reversal is expected to be.
How to Trade the Engulfing Candlestick Pattern
Ideally, you should incorporate multiple timeframe analysis and key support and resistance levels when trading the engulfing candlestick patterns. Note that engulfing candlestick patterns are only effective when the market is trending. After all, the prerequisite for its formation is a well-established bullish or bearish trend. So, if you spot bullish or bearish engulfing candlestick patterns in a non-trending market, it’s best to ignore them.
In practice, perfect engulfing patterns are rarely seen. But whichever form of engulfing candle pattern you encounter, the trading strategy remains the same. Generally, the wicks of the engulfing candles are ideal levels for entry and setting the stop loss. Here’s how to trade the engulfing candlestick patterns.
How to Trade a Bullish Engulfing Candlestick pattern
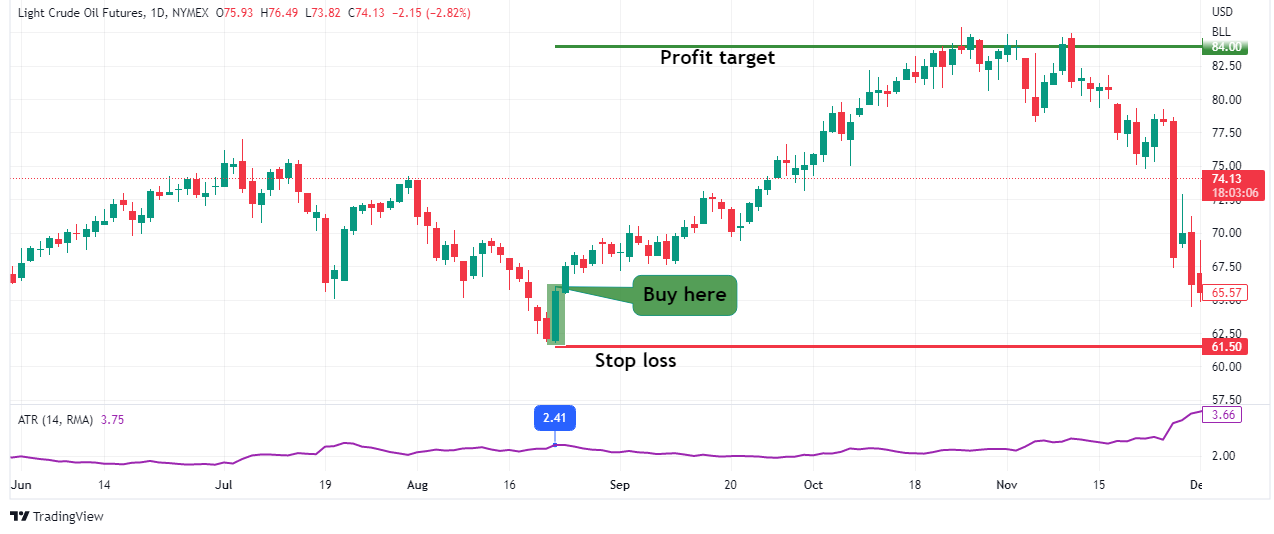
When the bullish engulfing candlestick pattern appears, we expect a trend reversal from bearish to bullish. As mentioned, it signals the start of a bullish trend with buyers flocking to the market; or short-sellers closing their positions. And in this case, the objective is to go long.
While it can be tempting to open a long position once the bullish engulfing pattern forms, it’s prudent to check whether the asset has reached its support. From a technical perspective, this increases the probability that the price has bottomed out.
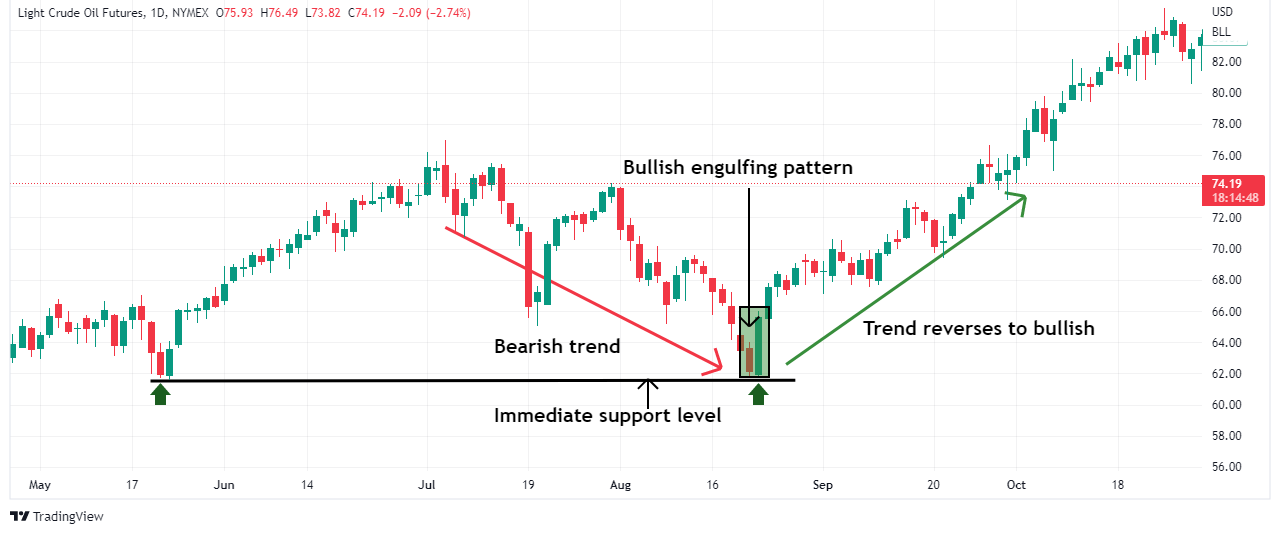
The upper wick of the engulfing candle should be the trigger for bullish entry. Since engulfing candlestick patterns work best in a trending market, you have two options for setting your profit target. You can put it around the previous resistance or base it on the prevailing market volatility. We recommend the latter, using the average true range (ATR) indicator. Your stop-loss target should be below the bullish engulfing candle.
How to Trade a Bearish Engulfing Candlestick pattern
When a bearish engulfing candlestick pattern forms, it signals a potential trend reversal from bullish to bearish. The pattern shows that bulls are getting exhausted, with sellers dominating the market, potentially pushing the price down. In this case, the objective is to short the market.
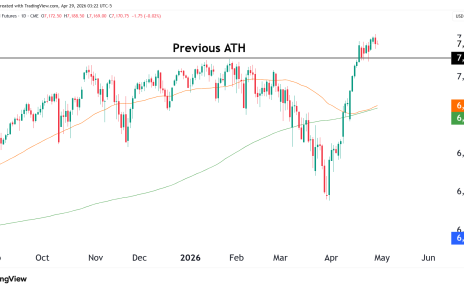
However, shorting the market immediately after the bearish engulfing pattern forms is not advisable. You should check whether the asset has reached its resistance. A pullback from the resistance increases the probability that the bullish trend has peaked. Here’s an example:

If the bearish engulfing candle had a long lower wick, your entry position should be below the wick. And you can set the stop loss above the candle. As for the profit target, you can set it around the immediate previous support level or base it on the prevailing market volatility. We recommend the latter, using the average true range (ATR) indicator.

The Bottom Line
The engulfing pattern is a dual candlestick pattern. It’s formed by two candles, with the second candle completely overshadowing the first one. As a reversal candlestick pattern, it offers the opportunity to enter the market in anticipation of a possible trend reversal. The bullish engulfing candlestick pattern signals a potential bearish to a bullish trend reversal, while a bearish engulfing candlestick pattern signals a possible bullish to a bearish trend reversal.
For more insights into candlestick patterns, read our related blog: Popular Candlestick Chart Patterns.
