- Potential reversal on the daily chart for bears to profit in the short term.
- The long-term still looks bullish.
Technical Analysis
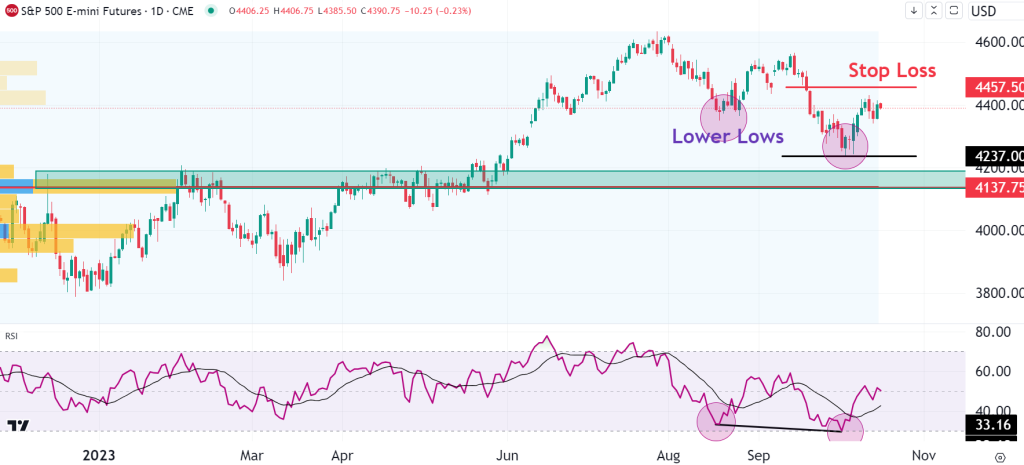
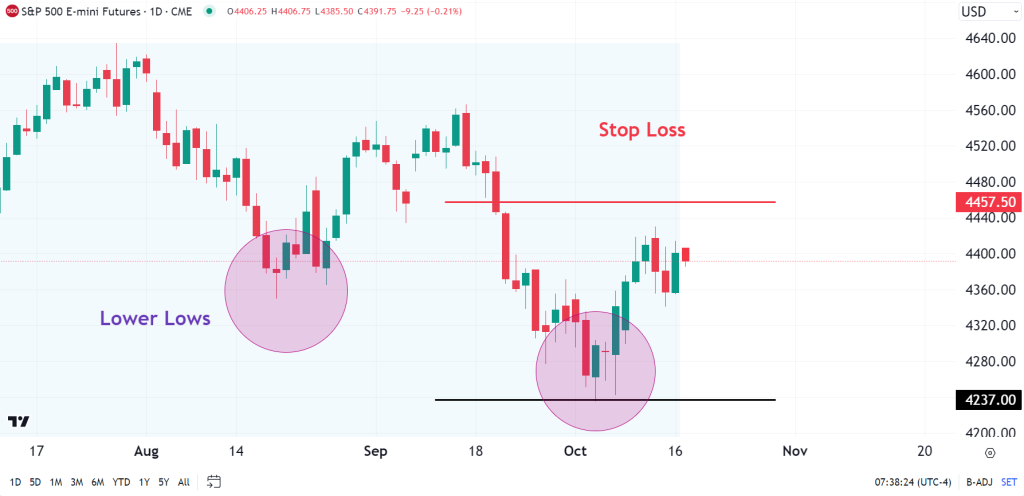
If we zoom out on the daily chart, there is a clear break of trend that has occurred after the high was put in at $4600. Since then there were two new lower lows formed on the daily chart, which I circled on the chart below, and the RSI confirmed both of them with no divergence.
ES has had a small bounce recently and could be showing signs of it rolling over once more to test the recent lows at $4237 so there is a short opportunity here with stop losses being placed above the swing high at $4457.50. Target 1 would be the swing low ($4240), and then see how price reacts at that level for a possible further drop. If it drops further, the next target is $4137 which is the point of control for the volume profile indicator and we can see a lot of support there if we look left on the chart.