RTY Chart Overview
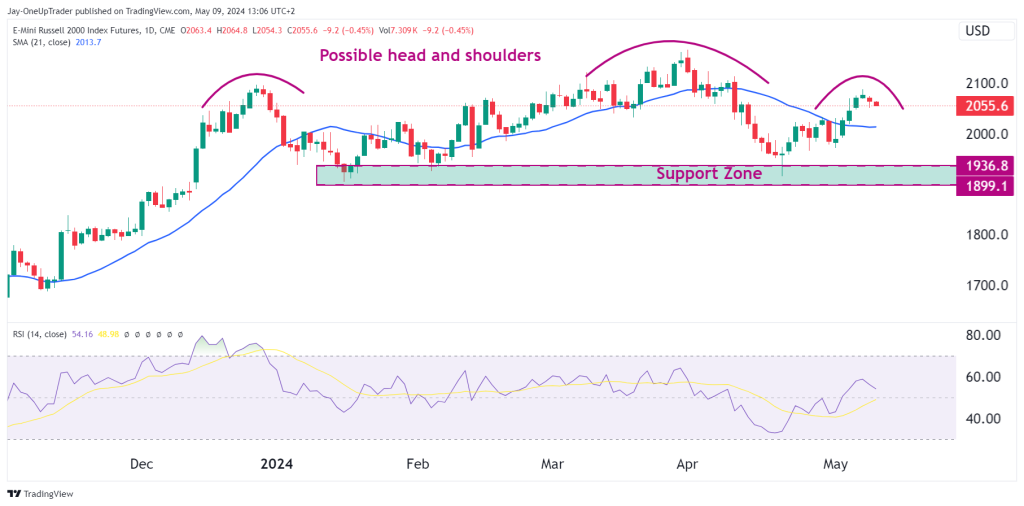
In this analysis, we’ll take a closer look at the daily chart of the E-Mini Russell 2000 Index Futures, focusing on the potential head and shoulders pattern, support zone, and key technical indicators.
Head and Shoulders Pattern
The chart highlights a possible head and shoulders pattern, which could lead to a bearish turn in the market if the price drops below the support zone. The formation consists of three peaks, with the center peak (head) being the highest and the two outside peaks (shoulders) being lower and roughly equal.
Support Zone
The support zone is between approximately 1899.1 and 1936.8, where the price has bounced multiple times, indicating strong buying interest at these levels. If the price manages to hold above this support zone, it could potentially invalidate the head and shoulders pattern and lead to further upside.
Technical Indicators
Simple Moving Average (SMA)
The 21-day SMA, shown in blue, acts as a dynamic support/resistance level. Currently, the SMA is below the price. The 21 SMA is a good way to judge short-term price action, and if the price is below it, it’s a sign that price action is bearish and should look for short trades in the short term.
Relative Strength Index (RSI)
The RSI is hovering around 54, indicating neither overbought nor oversold conditions. The RSI trend, moving upward from the midline (50), suggests that there might be some increasing bullish momentum, although it is not yet strong. Traders should monitor the RSI for any significant moves towards the overbought (above 70) or oversold (below 30) levels, which could signal potential trend reversals.
Bullish vs. Bearish Scenarios
Bullish Scenario
For a bullish outlook, the price needs to remain above the support zone and ideally break above the SMA. This could potentially invalidate the head and shoulders pattern and lead to further upside, targeting previous highs near 2064. Traders could look for long entries with stops below the SMA if the price breaks and holds above this level.
Bearish Scenario
A bearish view would be confirmed by a price break below the support zone. This would also coincide with a completion of the head and shoulders pattern, potentially leading to a sharper decline, with further levels of support not visible on this provided chart. We could consider short positions if the price breaks below the support zone.
Forecast and Trading Strategy
Short-Term
Bears are hoping the possible head and shoulders will play out. If price drops below the support zone, a short could be taken with a stop above the zone. If price bounces from the support, a long could be taken with first target being around $2,060.
Conclusion
The E-Mini Russell 2000 Index Futures chart presents a critical decision point with the formation of a potential reversal pattern and the test of key support levels. We must be flexible and ready to adapt to either a bullish breakout or a bearish breakdown, using the SMA and RSI to confirm momentum. As always, it’s essential to manage risk effectively and incorporate other forms of analysis, such as fundamental analysis and market sentiment, to make well-informed trading decisions.