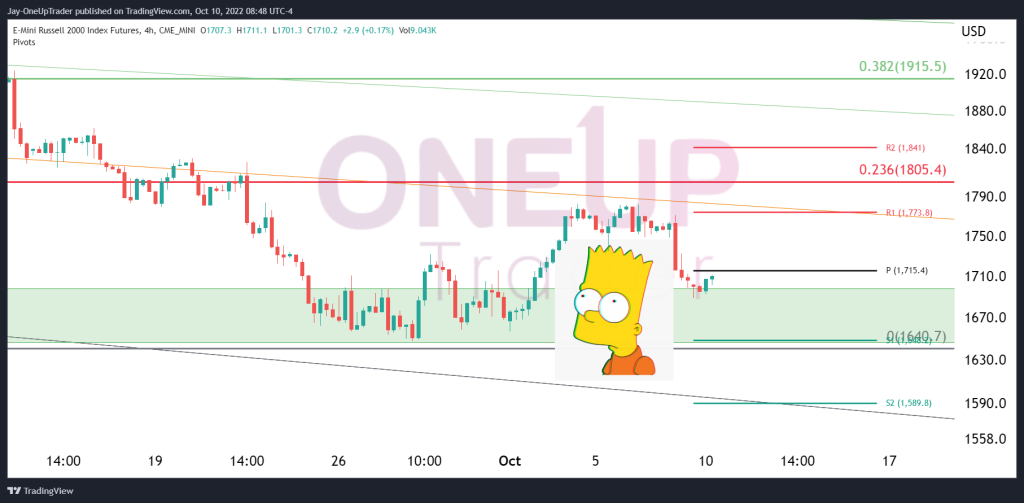
- A Bart Simpson Pattern on 4 Hour chart
- Anticipating Long opportunities around key levels
Bart Simpson Pattern
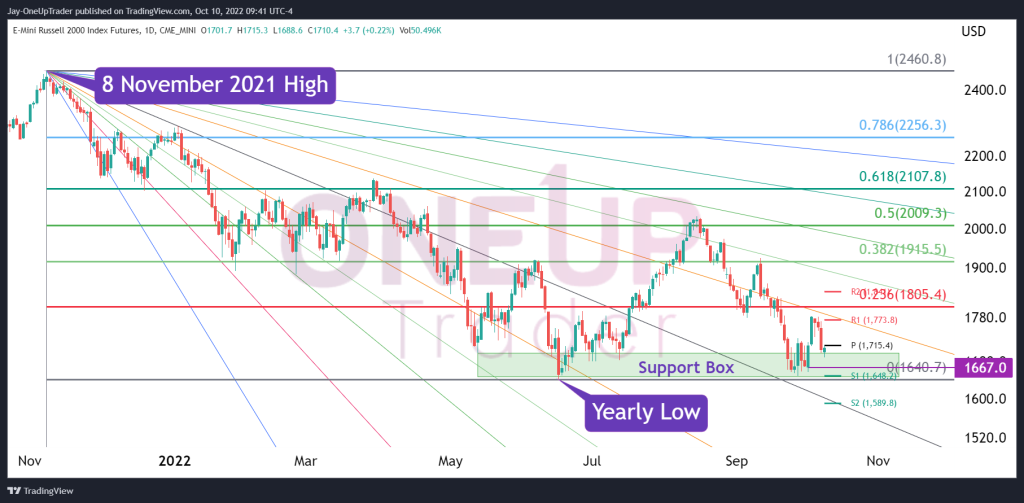
A Bart pattern has been completed on the 4 hourly charts. It’s usually a good pattern to trade in a downtrend as a continuation pattern. However, since the price has retraced into the multi-year support zone, we expect a price push to the upside from here to the first R1 level on our pivot points at $1,773.8. The target can be extended to $1,805.4, which is the 23% Fibonacci retracement level from the high made on November 8, 2021, to the low this year. Go here to learn more about the Bart pattern.
Looking For Longs
Looking at the daily chart, the most significant technical indicator at the moment is the support box which has held this year’s low. There have been sufficient amounts of buying each time price has retraced into this level, so we are looking to accumulate long positions around these levels ($1,701) or lower, with our risk set below the yearly lows of $1,699.7.