- The Monthly chart is extremely bearish.
- We could see the price touching $10,000 as a possible target.
- Gaussian channel retracements provide short entries on the 4H chart
Monthly Candles
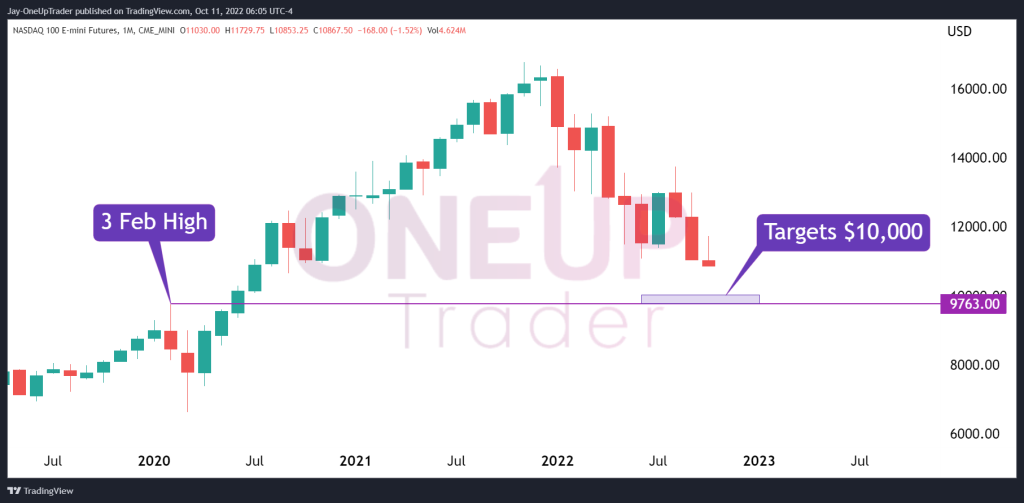
The monthly chart is bearish as prices trade below the year’s low of $11,068. The candle for this month also seems to be in a free-fall status as we approach the middle of the month. We could see more downside before this month’s candle closes. If the price closes below $10,800, it’ll give further confluence to the lower targets we have set at $10,000.
The target of $10,000 is the only key level we see of significance. Looking back at the chart, the high formed on Feb 3, 2020, was a significant swing. That’s 10% away from where prices are trading now.
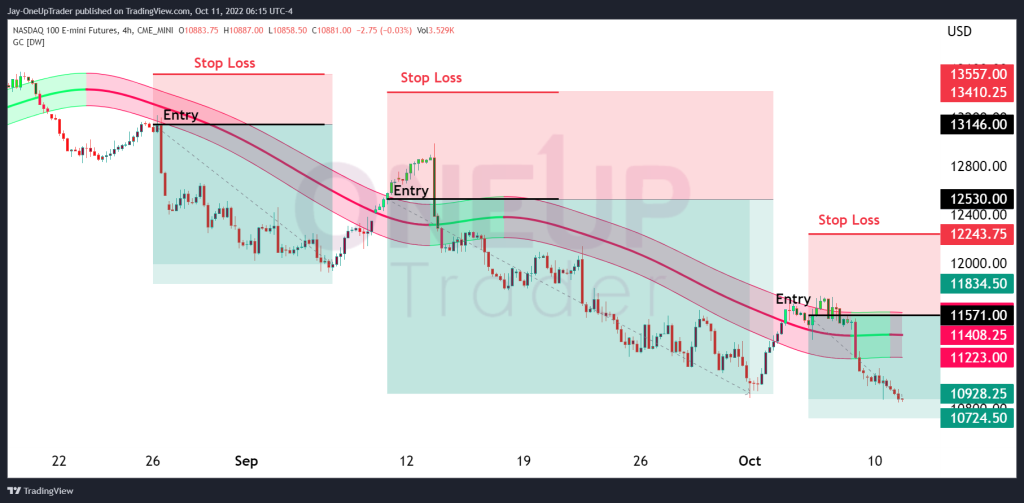
Gaussian Channel Entries To Take Advantage Of The Downtrend
We see great shorting opportunities on the 4 hourly chart by waiting for the price to retrace within the gaussian channel and then slowly initiating shorts. Take a look at the video we posted regarding the Gaussian channel.
At the moment, we see very little pointing toward upside potential, so we are currently only looking to take shorts into relief rallies and short squeezes. It must be emphasized that stop losses are wide enough to avoid being stopped out on our positions prematurely while we have the correct trade bias.