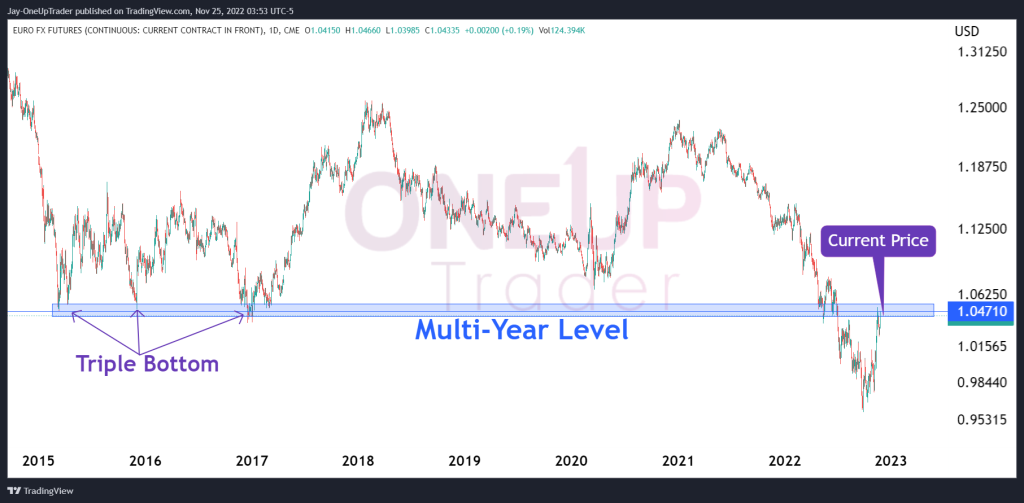
- Multi-Year Resistance zone spotted on the weekly chart.
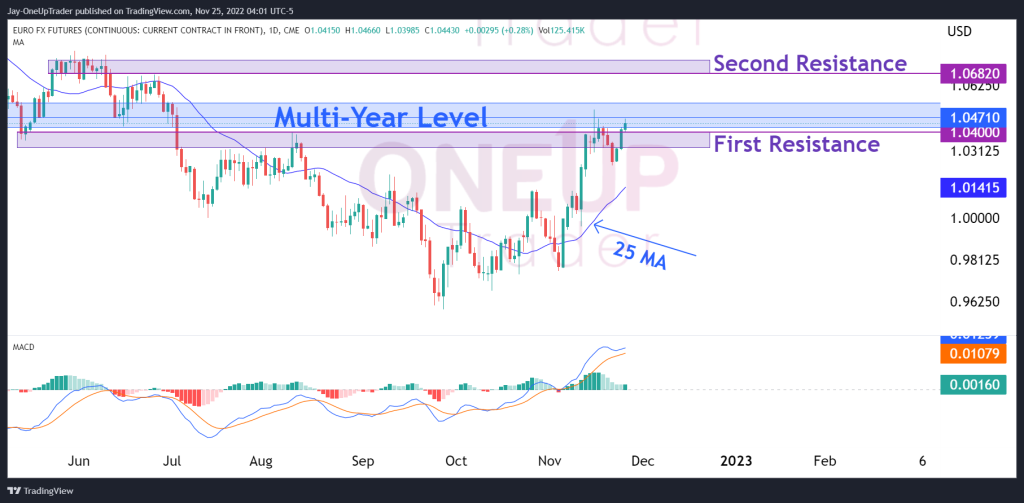
- Forward-looking potential bullish targets.
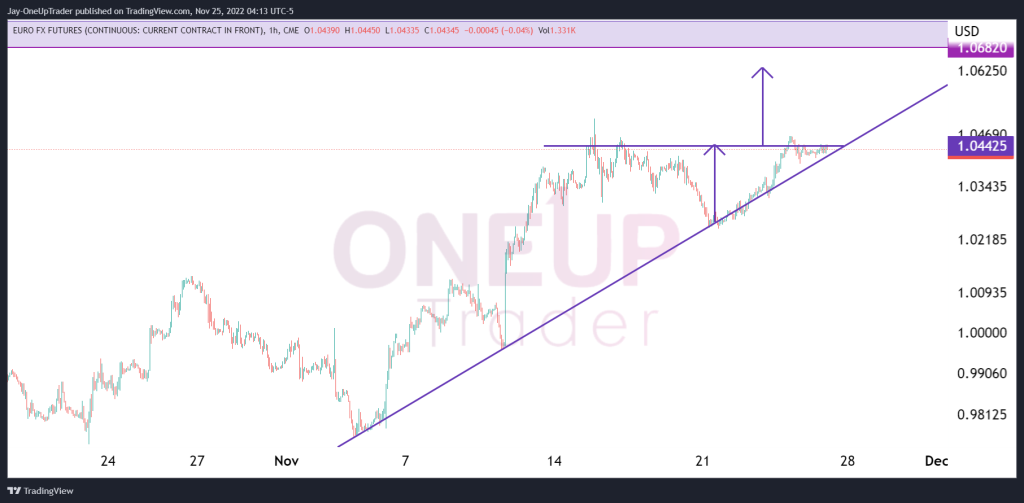
- Ascending Triangle pattern found on the hourly chart.
Multi-Year Resistance at 1.0471
Zooming out on the daily chart for Euro, we can see that the price is currently trading within a multi-year resistance zone at 1.0471. In 2015 – 2017, a triple bottom formation led to the Euro surging about 20% in price. Back in May of this year, the market fell into the same zone and acted as temporary support, but ultimately the Dollar proved too strong, and the price fell through the zone.
As the Dollar weakens, we see the price rally back into the zone, which could lead to a minor hurdle as the price attempts to gain strength over the Dollar.
Forward-Looking
The Euro currently trades above the first resistance zone at 1.047. If there is adequate buying, this zone could act as an area for accumulation which may eventually send the Euro higher toward the second resistance zone at 1.0682.
At the moment, the MACD is bullish, and the market is firmly above the 25-moving average.
Ascending Triangle Analysis
6E is currently trading right at the top of the ascending triangle horizontal resistance line. If a breakout does occur, we could likely see the price rally all the way up to our second resistance zone mentioned above. This would also indicate that the market is expecting the rate hikes to come in slightly slower in the near future. You can check out our Youtube channel to learn more about the ascending triangle.