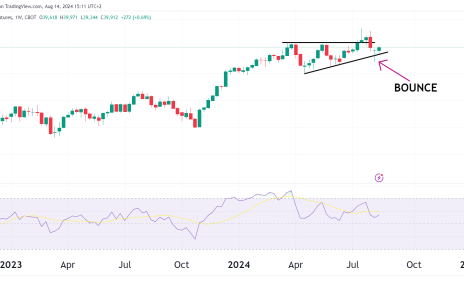
- Price action retraced back to the 38% Fib level and bounced twice.
- A triangle formation has been spotted on the daily chart.
- An important note on risk management.
Technical Analysis
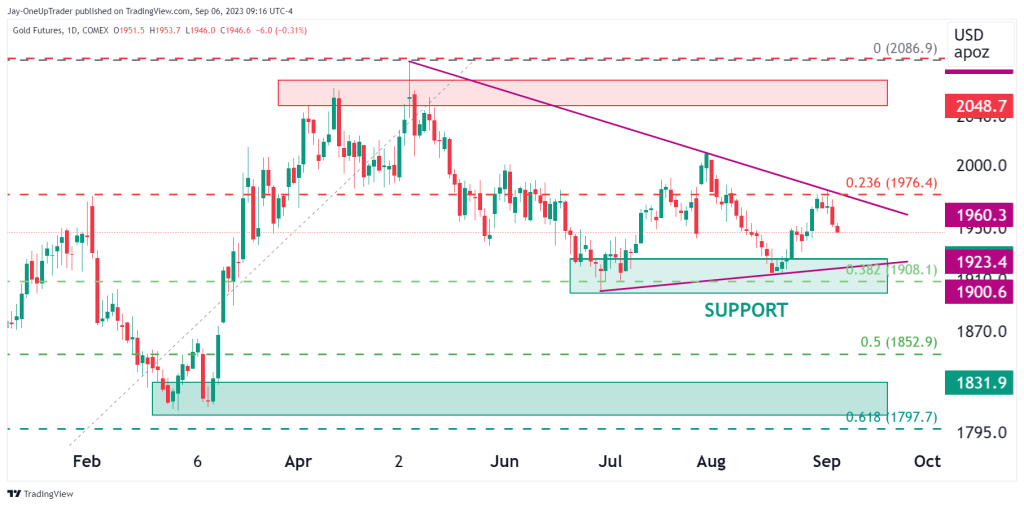
Once gold reached a high of $2,085 this year, we saw an 8.8% retracement a few weeks back. GC has now settled at $1,960.3, and the price action is forming a rectangle formation that could send it soaring or crashing with great volatility. The last time we looked at Gold, we noted an important support zone at $1,908 where we could begin accumulating. You can see that article here to give you some context before we continue.
Fibonacci:
The retracement went to the 38% level and found adequate support there for the price to remain propped up for now. Price tested this level twice and has now formed the start of a symmetrical triangle pattern.
Triangle:
There are three connecting points for the triangle at the top, and there are two at the bottom. When we see this formation in financial markets, usually, we see the third connection being formed to complete the triangle. This would mean that we see GC fall to around $1,910, find support, and then back up to $1,960 before price eventually breaks out.
Risk Management
Risk management is like the safety net in the high-wire act of trading. It’s not just important; it’s downright essential. Imagine you’re crossing a tightrope without a safety harness – that’s trading without risk management. It’s about protecting your hard-earned money. You don’t drive without a seatbelt, right? Well, in trading, risk management is your seatbelt. It means setting limits on how much you’re willing to lose, diversifying your investments, and not putting all your eggs in one basket. It’s the difference between sleeping peacefully and losing sleep over market swings. So, remember, in trading, risk management isn’t an option; it’s your financial survival kit.