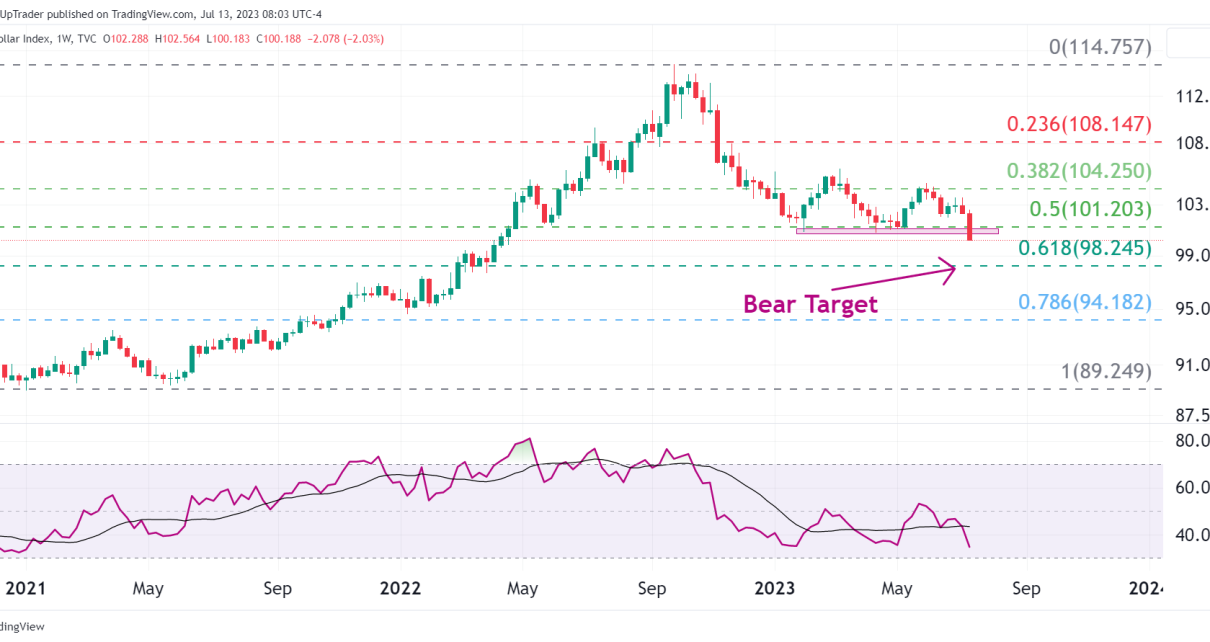
Multi-Year Resistance zone spotted on the weekly chart. Forward-looking potential bullish targets. Ascending Triangle pattern found on the hourly chart. Multi-Year Resistance at 1.0471 Zooming out on the daily chart for Euro, we can see that the price is currently trading within a multi-year resistance zone at 1.0471. In 2015 – 2017, a triple bottom Read More…
Tag: USD DOLLAR INDEX
Dollar Index Rallies Amid Fed’s Rate Hike
The US Dollar has rallied 18% this year due to an aggressive interest rate policy. Correlation between the Dollar and the Equities Futures markets. Technical Analysis on the US Dollar. Dollar Likely To to Remain Stronger The US Dollar has rallied this year by more than 18% due to the aggressive policy outlined by the Read More…
Weekly Technical Market View: 31st August – 4th September 2020
US Dollar Index: On August 19, the daily support’s response was at 92.26 and this S/R level has been dynamic since late 2017. Unfortunately, it didn’t last long as it topped above daily supply at 94.02/93.56 on August 21. Within the week, the support which was down by a percent re-entered the frame on Friday, Read More…