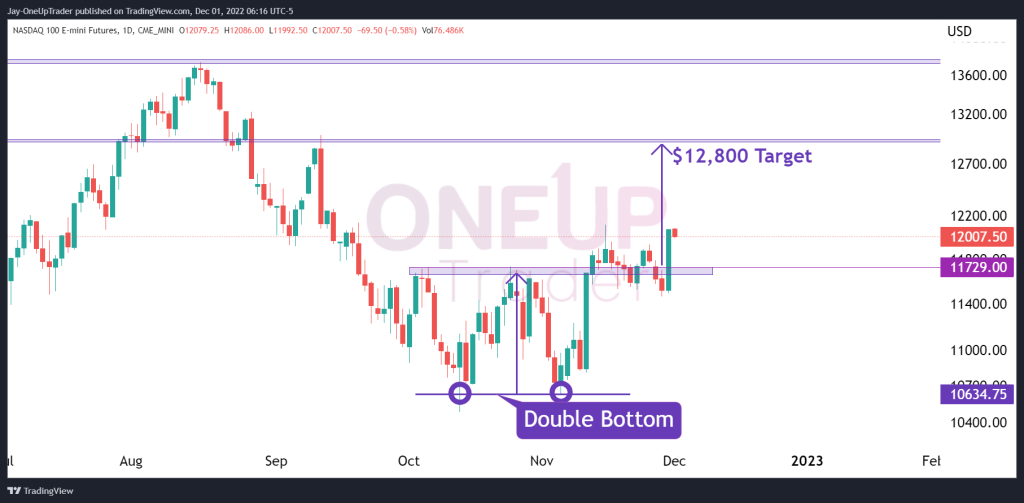
- The double bottom formation was confirmed after Powel’s comments yesterday.
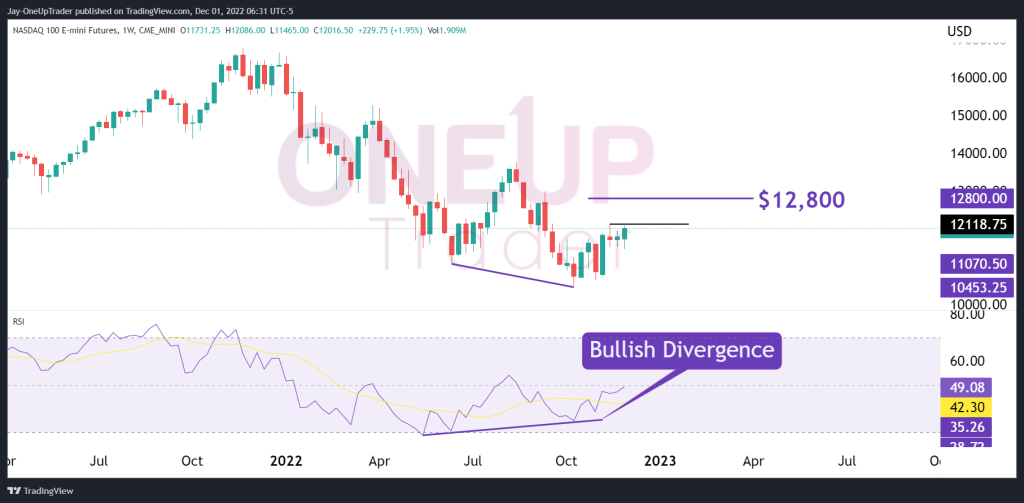
- A Bullish divergence pattern is spotted on the weekly chart.
- Momentum is firmly in the bull’s favor.
Massive Price Rally in NQ
Wall Street jumped on Wednesday after Federal Reserve Chair Jerome Powell said the central bank might scale back the pace of its interest rate hikes as soon as December. We saw NQ rally nearly 5% towards the end of the session giving legs to a potential double-bottom formation. The pattern developed over the months of October and November. The market bounced around the high of the formation (11,729) a few times and only yesterday have we seen a convincing green candle. If the rally continues, the first target for the double bottom is 12,800.
Weekly Chart Bullish Divergence
The weekly chart is finally showing signs of a weakening bearish sentiment as we see Bullish divergence on the RSI. If we look at all the bullish signals coming through at the moment, there is very little for Bears to feed on.
The two small spinning top candlestick patterns on the weekly also show a consolidation period which was the pause in the continuation move. NQ is very close to breaking above the high of those spinning tops at 12,118, and if we see that happen, the price could rally aggressively into the close of the week.
Summary
The bullish case has been growing slowly over the past month and has now been solidified by the words of Powell yesterday. The double bottom and the bullish divergence on the weekly chart mean that a further rally is most likely on the cards. Once again, we need to see the momentum continue with NQ breaking above 12,118 for the targets of 12,800 to be in play.