

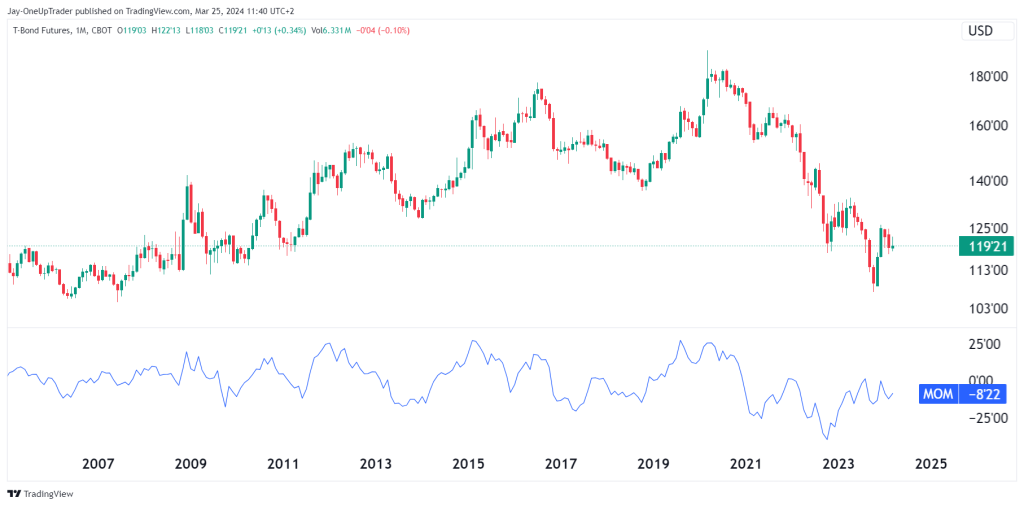
Monthly Chart Analysis:
The long-term monthly trend has revealed a downward pressure since its peak around 2020. However, recent candles suggest a potential stabilization. The Momentum indicator has dropped into negative territory, which tells us there is a slowdown in the selling pressure.
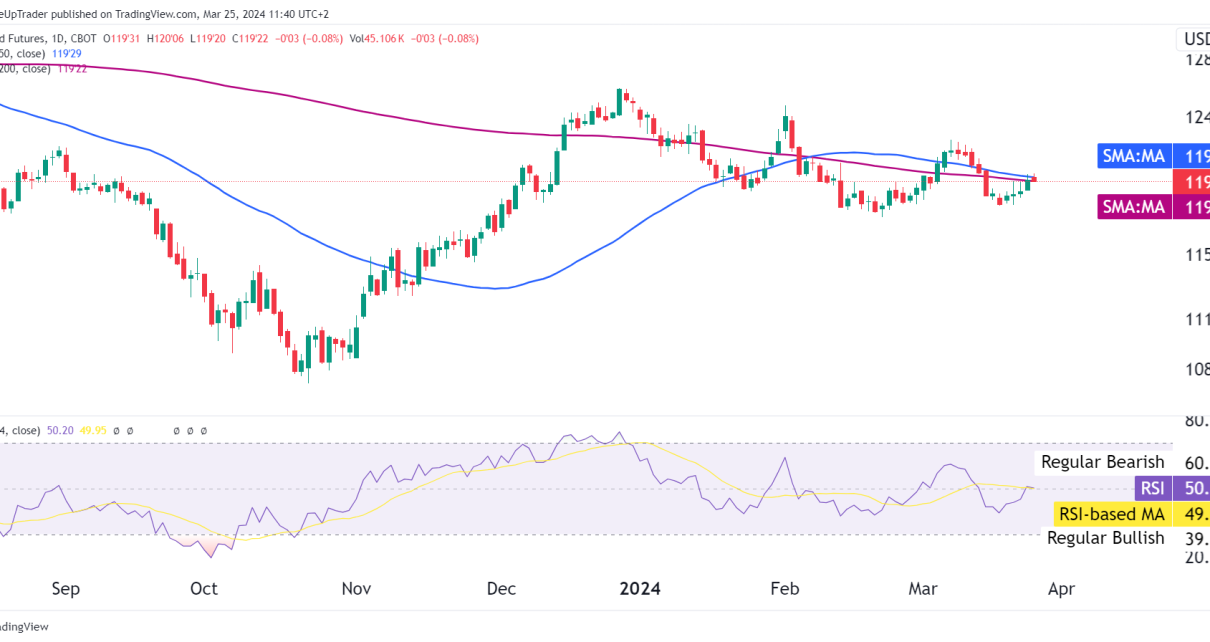
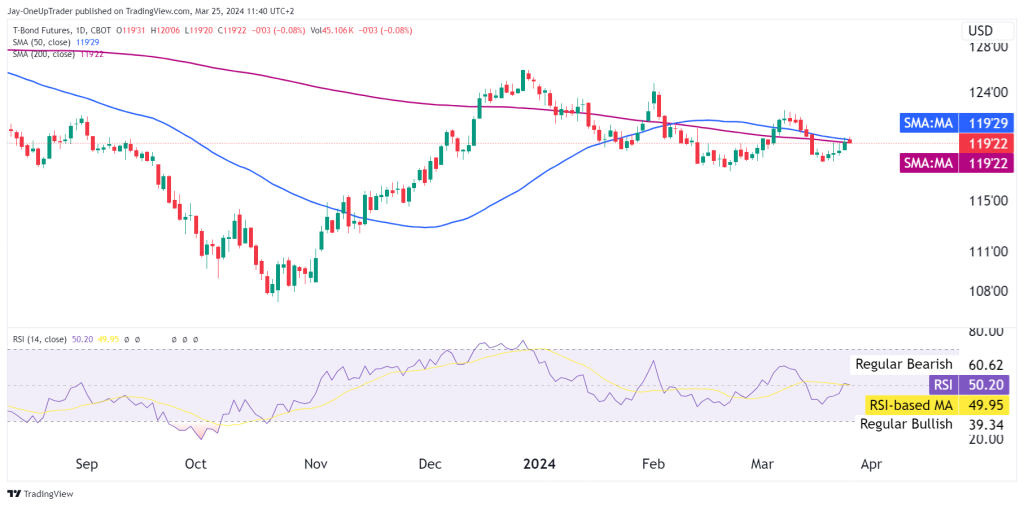
Daily Chart Analysis:
Price action has settled around key moving averages as the battle between buyers and sellers for market control continues while the FED makes big shifts on their policies.
Trade Opportunities:
This is a prime setup for range traders. We can anticipate a potential return to mean values. Buying near support levels, such as the recent lows, with a stop-loss order placed below, offers a high-probability trade. Traders should target the upper range of the recent price consolidation, near the 50-day SMA at 11929.
Rating:
The market receives a neutral rating. Given the recent price stabilization, there is a clear opportunity for a rebound towards the moving averages.
