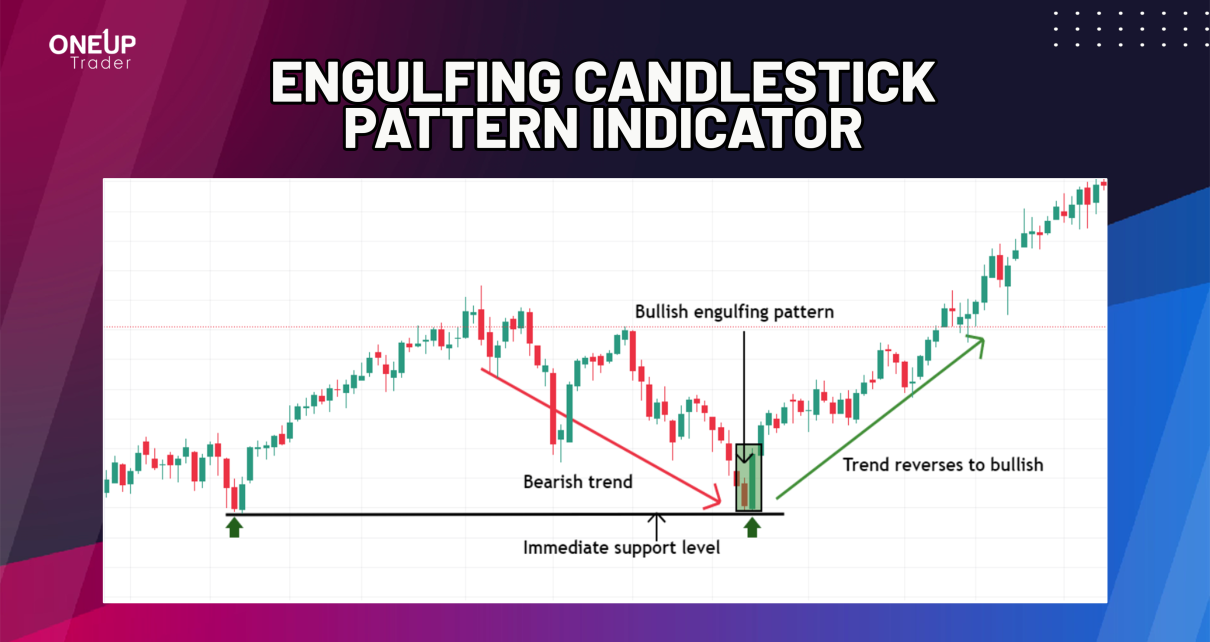
The engulfing candlestick pattern signals potential trend reversals. And since candlesticks patterns are not laggy, you have a higher probability of catching the onset of a trend. Throughout this guide, we’ve discussed how you can identify bullish and bearish engulfing candlestick patterns and how you can use them to trade market reversals. What is the Read More…
Technical Analysis
E-mini Nasdaq 100 (NQ) Futures Rally As Powell Eyes Slower Rate Hikes
The double bottom formation was confirmed after Powel’s comments yesterday. A Bullish divergence pattern is spotted on the weekly chart. Momentum is firmly in the bull’s favor. Massive Price Rally in NQ Wall Street jumped on Wednesday after Federal Reserve Chair Jerome Powell said the central bank might scale back the pace of its interest rate hikes Read More…
Technical Analysis: Gold Rallies to Hit Price Target at 1,780
The first target of $1,780 is very close to being hit as Gold rallies. Potential catalysts that could send the price lower. Quick Recap On Last Week’s Gold Analysis The bounce off the 100 EMA, Point of control, and 0.236 Fibonacci retracement level has already resulted in Gold gaining about 25 points since we did Read More…
Technical Outlook: Channel Analysis for Russell 2000 (RTY) Futures
Trend channel identified on the 4-hourly chart. Analysis of the order block on the 15-minute chart. Trend Channel Analysis Looking at the 4-hourly chart, there is a strong bullish channel that we can take note of. Currently, the price of RTY is trading around the low of the channel, and it may be ideal to Read More…
1-2-3 Reversal Pattern Back On The Cards For Crude Oil (CL) Futures
The long-term 1-2-3 reversal targets are back on the cards Short opportunities on the 30-minute chart. The 1-2-3 Reversal Pattern We must go back to September to view our analysis of the 1-2-3 reversal. Since the market has now broken below recent lows, the bearish target is in play. You can view that article here. Read More…
Technical Analysis: A New Look At The Euro (6E) Futures
Multi-Year Resistance zone spotted on the weekly chart. Forward-looking potential bullish targets. Ascending Triangle pattern found on the hourly chart. Multi-Year Resistance at 1.0471 Zooming out on the daily chart for Euro, we can see that the price is currently trading within a multi-year resistance zone at 1.0471. In 2015 – 2017, a triple bottom Read More…


