- The first target of $1,780 is very close to being hit as Gold rallies.
- Potential catalysts that could send the price lower.
Quick Recap On Last Week’s Gold Analysis
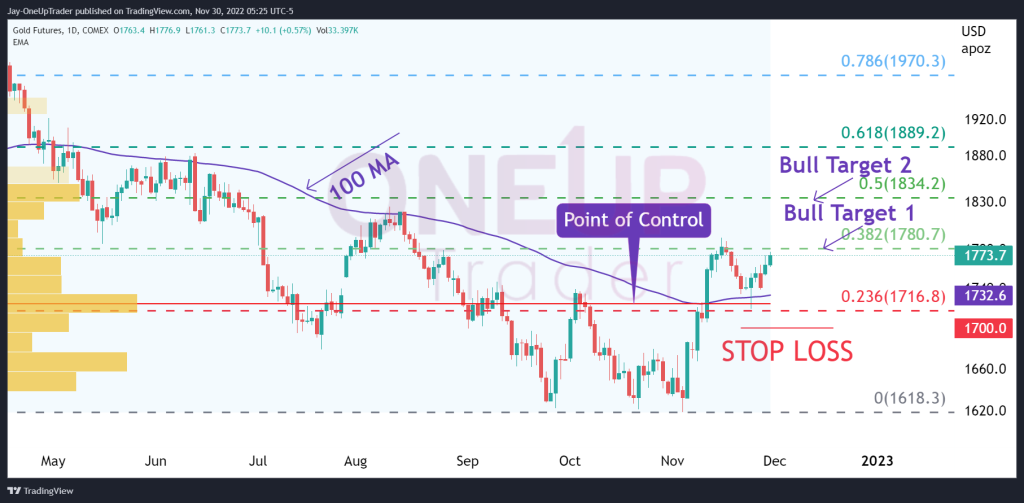
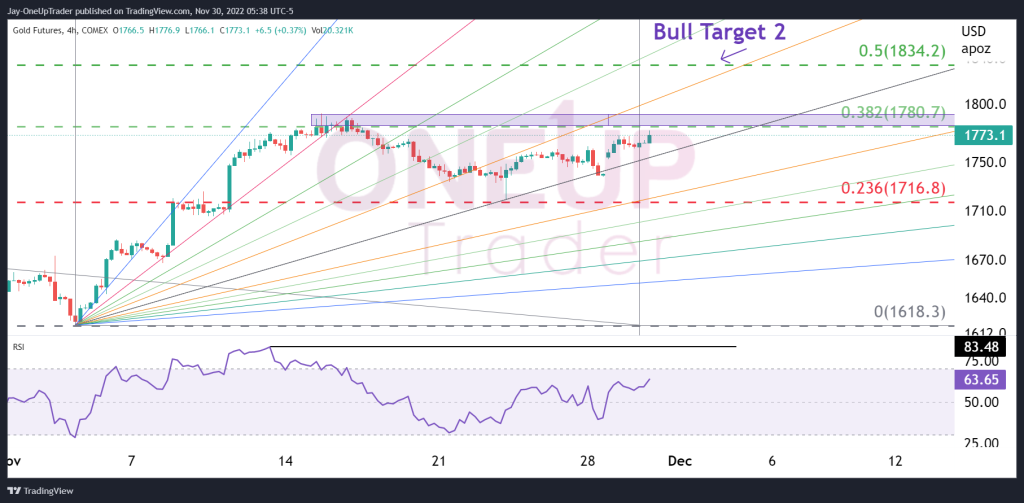
The bounce off the 100 EMA, Point of control, and 0.236 Fibonacci retracement level has already resulted in Gold gaining about 25 points since we did our analysis last week. The first target of $1,780 is only a few points away, and the trend looks bullish. If we see a price break through the 0.382 Fib level ($1,780), then we have a good reason to believe the second target of $1,834.2 is reachable.
Potential Bumps In The Bulls Road
RSI
The RSI is currently printing 63.77 on the 4-hourly chart, and when the high was made recently on November 16th, it was printing 83. It’s too early to tell if there could be a bearish divergence, but if GC pushes through the level mentioned above, we ideally want to see the RSI at 80 or higher.
The Fed’s Stance
The next Fed meeting is on December 14th. Markets have priced in an expectation of a 50 basis point hike; however, it will all come down to the path they lay out for the future, which will play a massive role in the price of Gold.
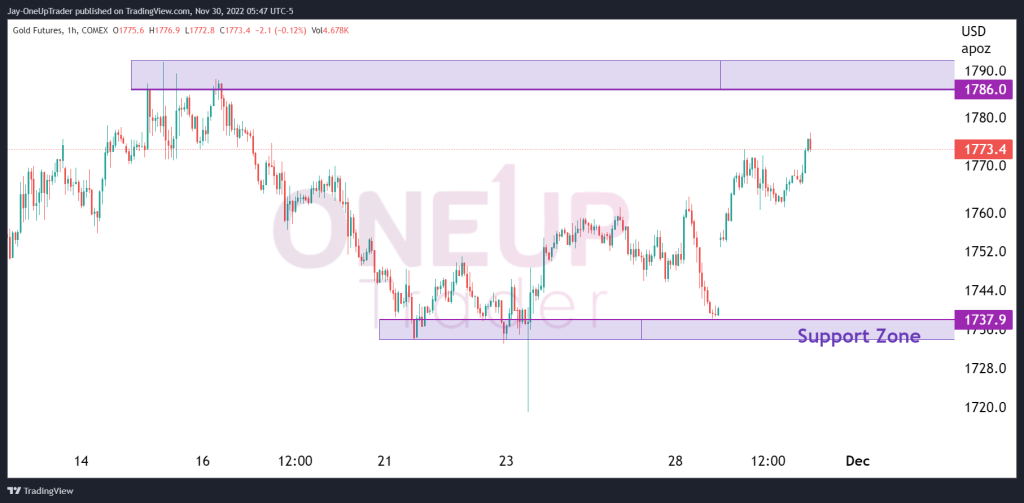
There is also the potential for Gold to sit in between the zone of $1,786 and $1,737.9. If the bulls fail to push the price towards the second target, then it’s possible we could see a consolidation phase as the market awaits the Fed meeting.