

Introduction
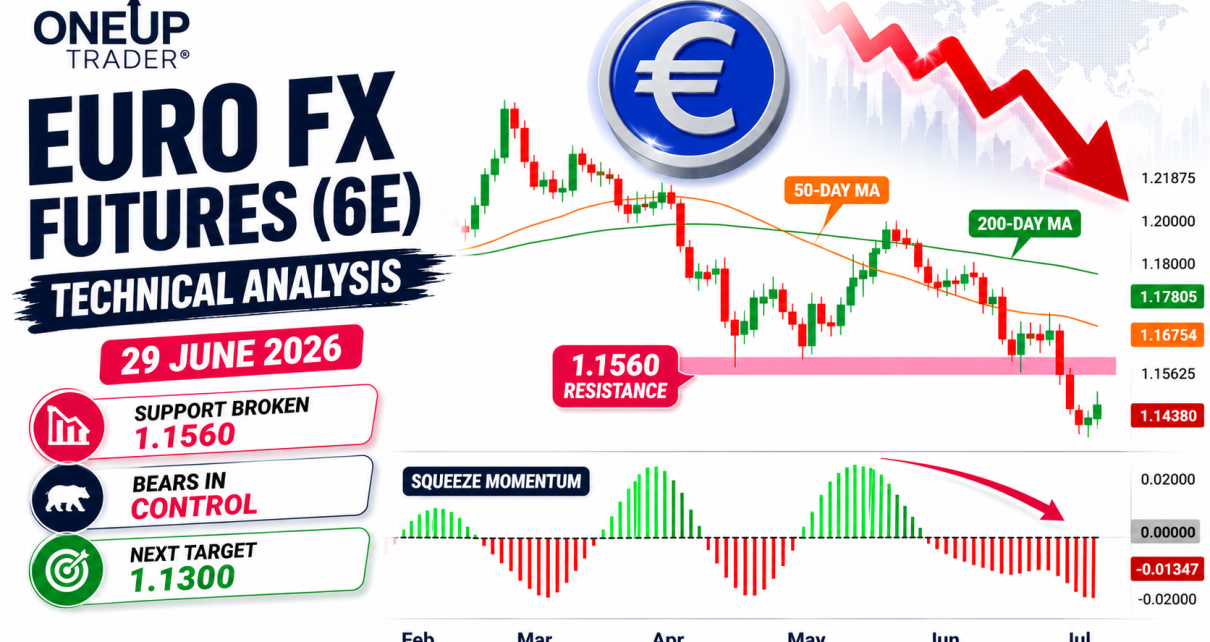
Euro FX futures continue to weaken following our previous analysis, with sellers finally breaking through the support zone that had been holding throughout March, April, and much of June.
It was important for the bulls to hold that support zone because now 6E is firmly in bearish territory, and any rallies could be looked at for short selling. Now that sellers are in control, lets take a closer look at the technicals and if there are any possible trades.
6E Futures Trend Analysis
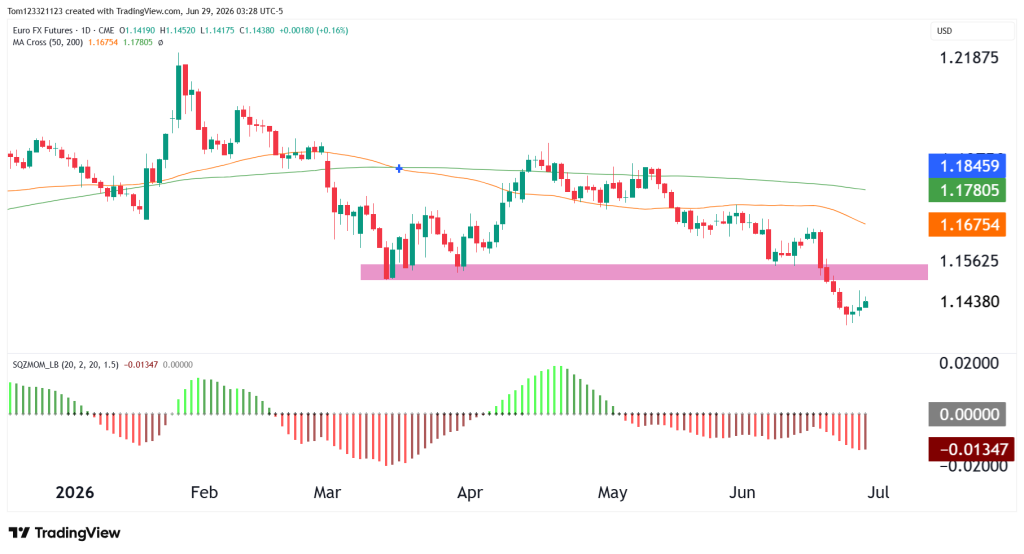
Both the 50 day and 200 moving averages are pointing downwards. The momentum indicator is also confirming the bearish price action. Most of this price action is due to the strength in the Dollar. Because the Euro FX futures are priced in Dollars, if we see DXY strengthening, then the Euro weakens.
Weekly Breakdown Strengthens The Bearish Case
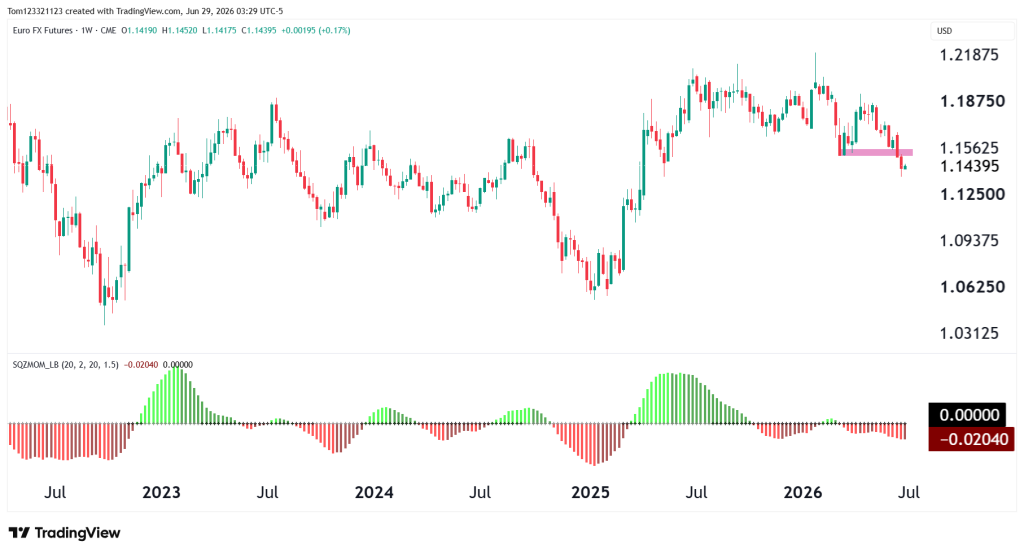
If we zoom out and look at the weekly chart, the bearish breakout becomes even more important. This is because the Euro has essentially been consolidating in the medium to long term. Since July, the price has been stuck in a sideways range, good for investors who parked their money somewhere for stability but not very good for swing and day traders.
There is not much support until 1.13 so if we see the market continue to decline, that would be the first stop for the bears. It is also important to note that what the Dollar does, is the most important thing effecting 6E. It is a difficult market to trade so all traders should be cautious about their positioning.
Estimated Probabilities for 6E Futures
| Scenario | Estimated Probability | Market Interpretation |
|---|---|---|
| Continued decline toward 1.1300 | 50% | Weekly and daily breakdowns remain intact |
| Consolidation below 1.1560 resistance | 35% | Market pauses before choosing the next direction |
| Recovery back above 1.1560 | 15% | Buyers reclaim broken support and weaken the bearish outlook |
Key Support and Resistance Levels
Major Resistance Levels
- 1.1560 former support
- 1.1680 (50-day moving average)
- 1.1780 (200-day moving average)
Major Support Levels
- 1.1300
- 1.1200
- 1.1000 psychological support
6E Possible Trades
Bearish Continuation Trade
Short below 1.15 with target 1.13.
Bullish Recovery Trade
For buyers, the first objective is reclaiming the broken 1.1560 support zone. Until that happens, any rallies are likely to be viewed as corrective moves within the downtrend. A sustained move back above the 50-day moving average would be the first technical sign that bearish momentum is beginning to fade.
This analysis is provided for educational and informational purposes only and should not be considered financial or trading advice. Trading futures, forex, and other leveraged financial instruments carries a high level of risk and may not be suitable for all investors. Past performance is not indicative of future results. Before making any trading decisions, conduct your own research, assess your risk tolerance, and consult with a qualified financial advisor if necessary.