


- Gold retracement gives a possible long reentry for the Bulls.
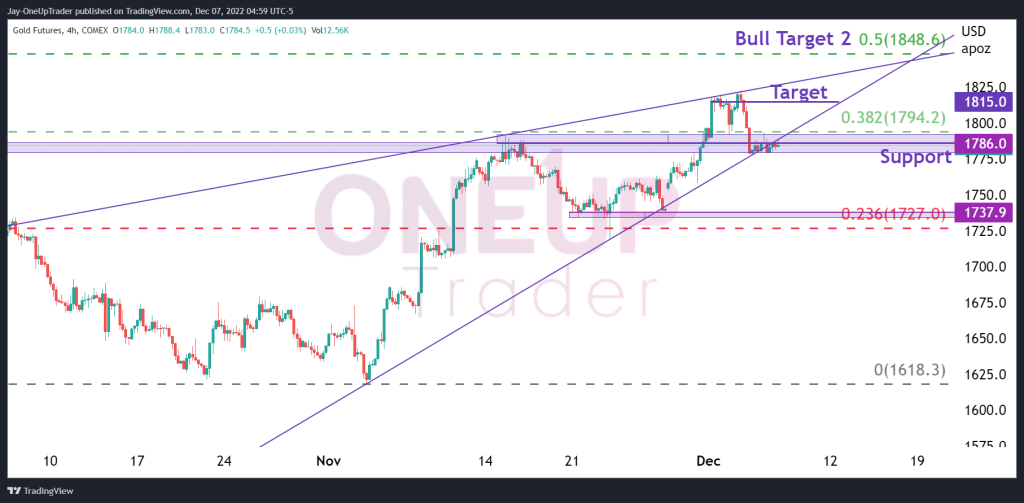
- Rising wedge pattern identified on the 4-hour time frame.
- Market overview as we approach the Fed meeting next week.
Quick Recap
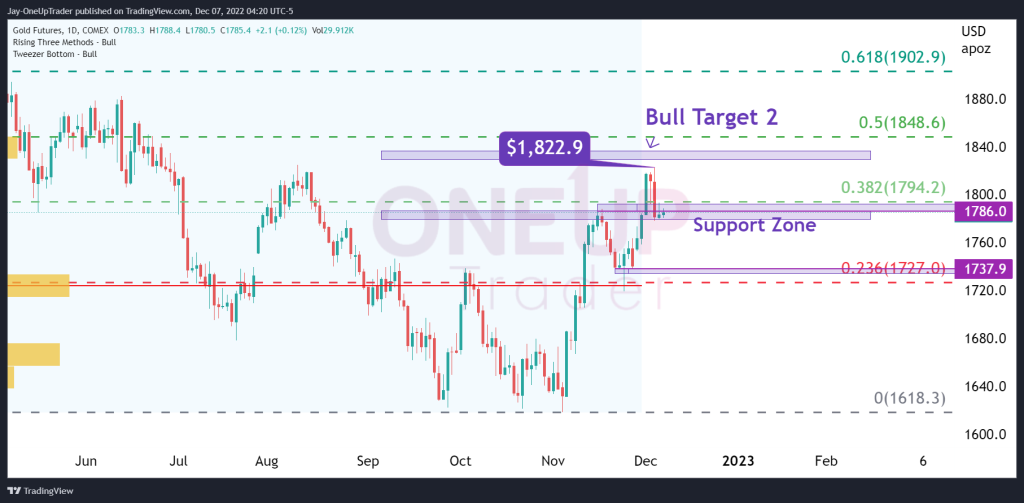
Gold Futures pushed through the $1,780 level mentioned in our analysis on December 2nd. The price has retraced from a recent high of $1,822.9 to $1,786., a minor support zone that bulls could use to enter into fresh longs if they believe the trend is still bullish. The zone is also in the range of the 0.382 Fibonacci level, which gives further conviction to the bull case.
Rising Wedge On 4-Hour Chart
Before we analyze the rising Wedge on the 4-hour chart, we must first understand that the pattern is unreliable. Generally, when we see a break of the Wedge, the trend does end but does not always reverse. Traders can use this information by holding off on initiating both long and short positions because there is a high chance of a consolidation period following the break of a Wedge pattern.
Looking at the 4-hour chart, there is a rising wedge that has formed. The support zone at $1,786, which was our target from last week, is currently holding. And if we see the price move higher from here, the targets would initially be $1,815, then $,1848.6 which is the Fib 0.5 level.
Summary
Gold has rallied from $1,618 from its low back on November 3rd to $1,822.9, which was yesterday’s high. The trend is up, and the main fundamental focus is the Feds meeting next week. The chart remains bullish, but traders must factor in the potential for consolidation if the rising Wedge breaks to the downside.