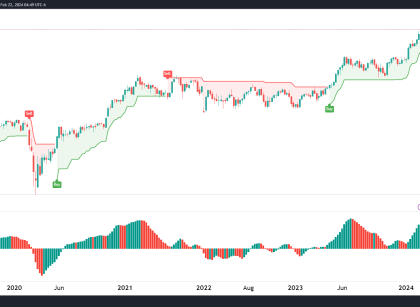
The market plunged last week, taking out key support levels as the daily chart resembles a rounding top formation. From here, the market still looks bullish in the medium to long term, but let’s take a look at the technicals and levels to watch for this week. You can see the $14,700 level, which was Read More…
Technical Analysis
Crude Oil Futures (CL): Technical Analysis
Last week’s crude oil technical analysis indicated that the price was on the verge of breaking its upward trendline. The 38% Fib line from last July’s high was a key reference point. Bears targeted the point of control line at $80, while bulls aimed to maintain control above $82 and eyed a move to $95.03 Read More…
Dow Jones Futures (YM): Technical Analysis & Long Trade Opportunity
Introduction YM is flat year-to-date but is only 10% away from all-time highs. With most equity indices, YM’s low was back in October of 2022, which is exactly one year ago. The price rallied 25% from there before retracing 7% to current price levels. Weekly Chart YM has been between $28,679 and $36844 since the Read More…
Is The New Bull Cycle Upon Us In Bitcoin?
News BlackRock has taken major steps toward launching a Bitcoin spot ETF, including listing the ticker symbol “IBTC” on the DTCC platform. The SEC has until January 2024 to approve or reject BlackRock’s ETF application. If approved, the ETF would significantly increase accessibility to Bitcoin investing for mainstream investors without dealing with crypto exchanges. This Read More…
T-Bond Futures (ZB) Technical Analysis
Introduction Bond buying has been going crazy since the start of the conflict in the Middle East, and anyone trying to catch a falling knife now has been burnt badly. Let’s take a look at all time frames to get an idea of how we can take advantage of these market moves. Monthly Chart The Read More…
Nasdaq Futures (NQ) Multi-time frame analysis
Monthly chart The monthly chart is the most interesting to look at out of all the time frames because of the possibility of an enormous 1-2-3 reversal pattern that could send NQ tumbling to $6000. This seems unlikely at the moment but is still a possibility if price reverses from here and falls below $10513.25. Read More…

