Gold futures have experienced significant volatility in 2024, driven by economic and geopolitical factors. After closing 2023 at $2,135.39 per ounce, gold prices have continued to rise, reaching new highs. As of mid-May 2024, gold futures were trading around $2,316 to $2,322 per ounce, with fluctuations influenced by the strength of the U.S. dollar and Read More…
Technical Analysis
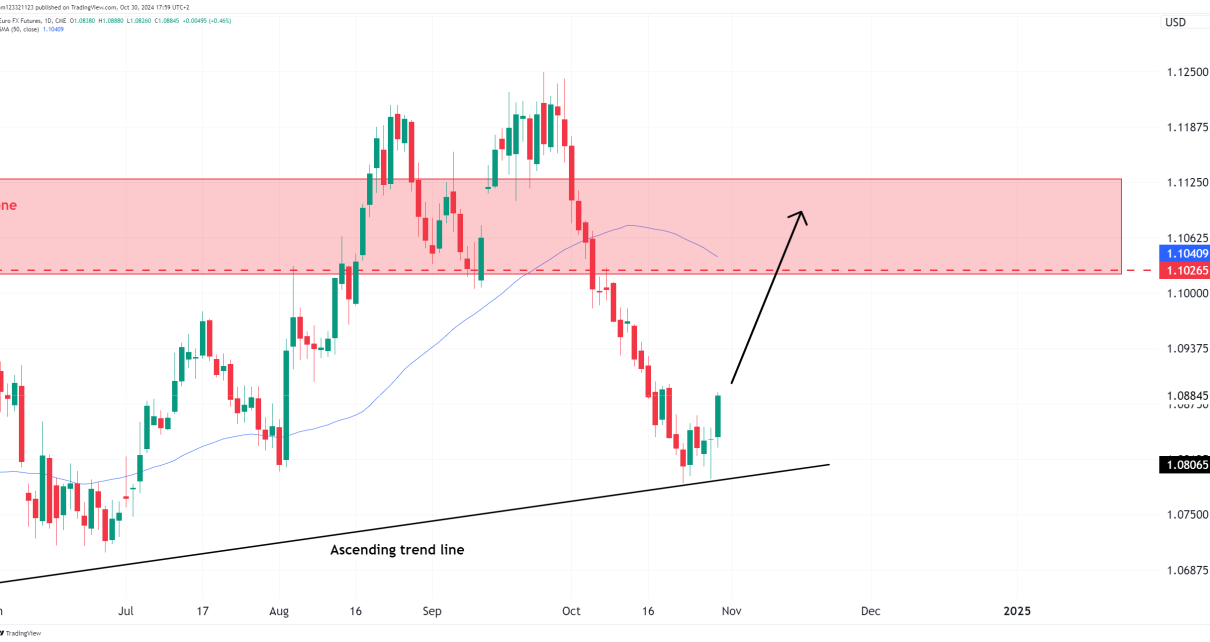
Euro (6E) Overbought? Technical Analysis & Trades
Introduction Based on the latest inflation data, the U.S. dollar is likely to remain stable or potentially strengthen in the near term. The slowing but steady inflation rate, coupled with the Federal Reserve’s decision to maintain interest rates at their current elevated level, could make the dollar more attractive to investors seeking a safe haven. Read More…
S&P 500 (ES) Hits All-Time Highs, Technical Analysis
Introduction The S&P 500 Futures (ES) has rebounded from its recent 7% pullback and broke above the all-time high on May 15th. Technicals look bullish and follow a trend. We can begin grinding down to shorter time frames, avoid looking for shorts, and focus solely on looking for longs on our short-term strategies. Why Daily Read More…
Dow Jones Futures (YM) Technical Analysis & Trades
Dow Jones Futures (YM) have slightly underperformed by about 5% vs. ES and NQ, but nevertheless, the trend is bullish. The key feature on the daily chart is the ascending triangle formation, which gives us a target at the 200% FIbo level. This is the bullish target for the medium term. Keep an eye out Read More…
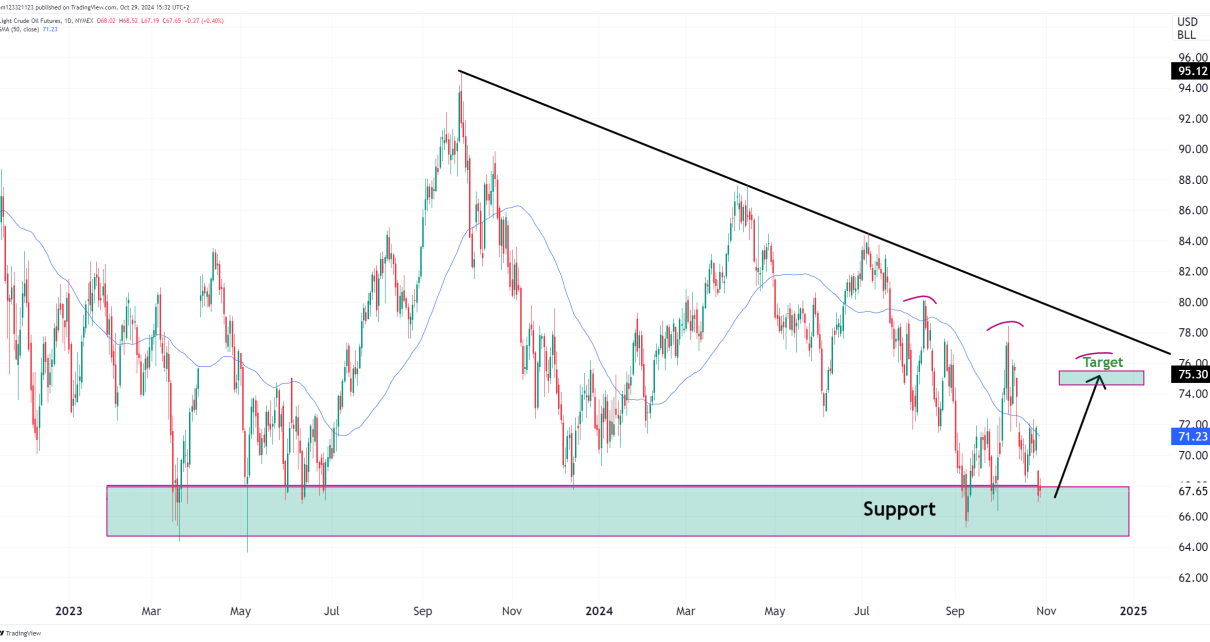
Crude Oil Futures (CL) Found a Technical Floor?
Introduction CL ended last week with a spinning top formation on the weekly chart after a fairly small range of trading. Volume was also slightly below the weekly average telling us that there was indecision in the market and a potential move coming up that we can capitalize on. The week prior we saw CL Read More…
Gold Futures (GC) Bulls Charge Back
Introduction Gold has been the standout so far this quarter as geopolitical tensions persist. It is not only acting as a safe haven, but the chart has some great formations we can take advantage of. The daily chart shows just how strong the trend has been since November 2023, with the 21-week Simple Moving Average Read More…