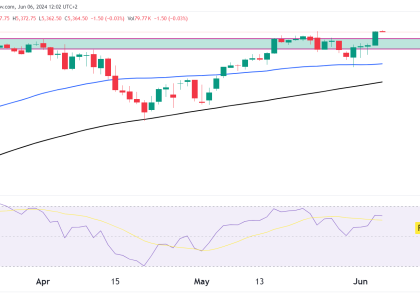
Russell has been severely lagging the big indices with 1 year performance at 7%, while NQ has posted a 47% increase in the same period. Is it finally time for the small caps to catch up? Weekly Key Levels to Watch on the Weekly: Daily Key Levels to Watch on the Daily: Potential Trades: Always Read More…
Technical Analysis
Technical Analysis for Gold Futures:
Weekly Key Levels to Watch on the Weekly: Daily Chart Observations: Key Levels to Watch on the Daily: Potential Trades: Given the current price action and the significance of the ATH level, we must be prepared for volatility and swift price movements. Traders should watch for a confirmed breakout or rejection at the ATH to Read More…
Technical Analysis for NASDAQ 100 E-mini Futures
Weekly Chart Key Levels to Watch on the Weekly: Daily Chart Key Levels to Watch on the Daily: Potential Trades: It’s essential to monitor these levels and adjust strategies accordingly. The rising wedge and RSI divergence should be watched closely for signs of a potential reversal. Remember to manage risks effectively, as markets can always Read More…
Dollar falling again? Technical outlook
Weekly Chart The U.S. Dollar shows a symmetrical triangle pattern, which is typically indicative of a continuation or a reversal pattern depending on the breakout direction. Price is sitting at the top end of the triangle and is also in a multi-year support/resistance zone. Key Levels to Watch on the Weekly: Daily Chart On the Read More…
Light Crude Oil Futures: Technical Outlook
Weekly Chart AnalysisThe Light Crude Oil Futures on the weekly chart have a clear consolidation pattern within a defined support zone. Volume Profile Visible Range (VPVR) indicates substantial trading activity at these levels. The Relative Vigor Index (RVI) is setting a steady momentum, with the RVI line slightly above its moving average, indicating a slight Read More…
Nikkei 225 surges; technical outlook
Weekly The weekly chart of the Nikkei Futures has been in a strong uptrend, as indicated by the SuperTrend indicator, which has been green for an extended period. The Awesome Oscillator (AO) is positive too as the Japanese index surges to new highs. Key Levels to Watch on the Weekly: Daily On the daily chart, Read More…


