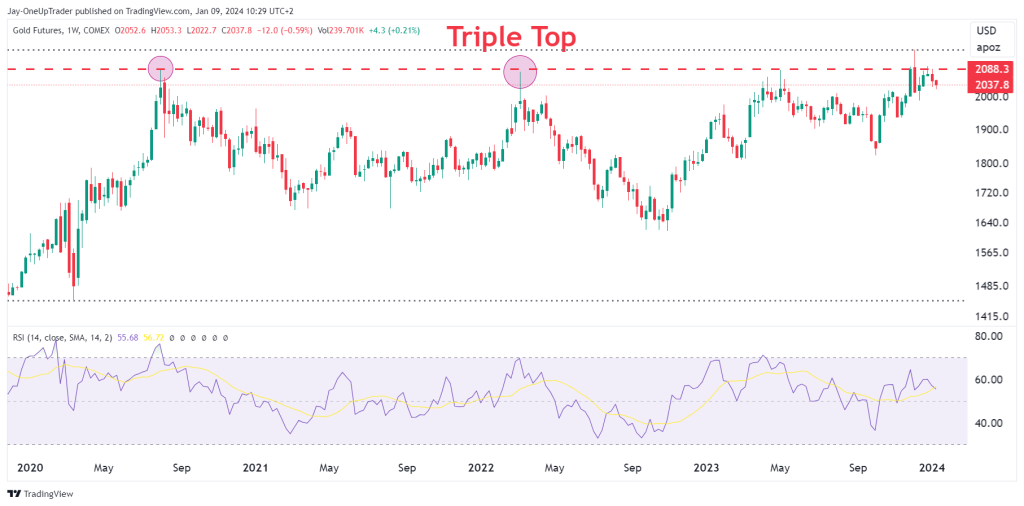
The weekly chart shows a triple-top reversal pattern forming, with resistance around $2088. This is a pivotal zone – if price can break out above $2088 decisively, it would invalidate the bearish pattern and imply an upside breakout. However, failure to break resistance could confirm the pattern and precede a downward move.
The weekly RSI reads 56.72, reflecting a neutral momentum profile. This provides flexibility in either direction without overbought or oversold extremes limiting price action.
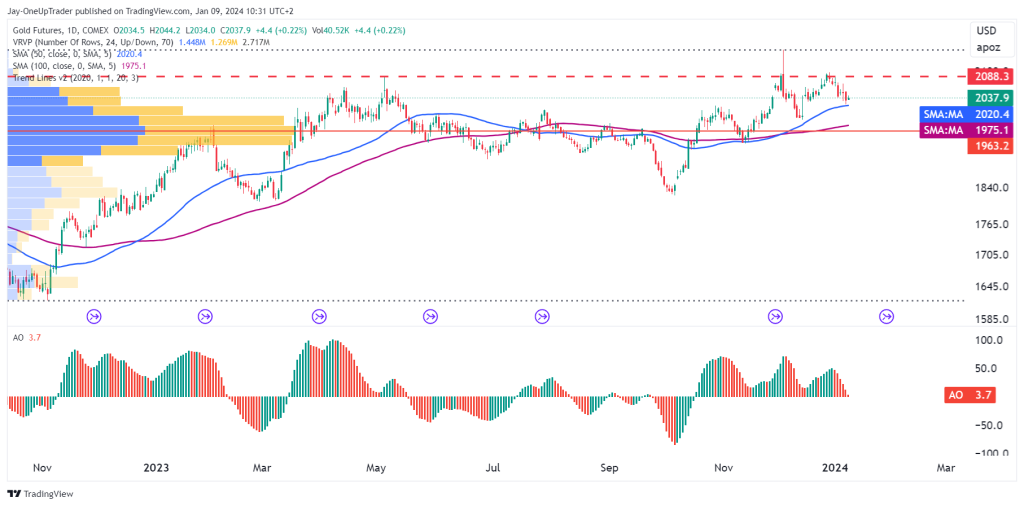
Daily technical analysis
On the daily chart, price oscillates around the 50-day SMA at $2020.40 and the 100-day SMA at $1975.10. These key moving averages have held as support and their integrity is important for the bull case. A sustained breakdown below the SMAs would compromise the uptrend.
The Awesome Oscillator shows a slight positive reading of 3.7 but its flattening histogram suggests fading upside momentum. This divergence warns of waning bullish momentum and the potential for a trend shift. We want to see the AO bars strengthen or risk giving up recent gains.
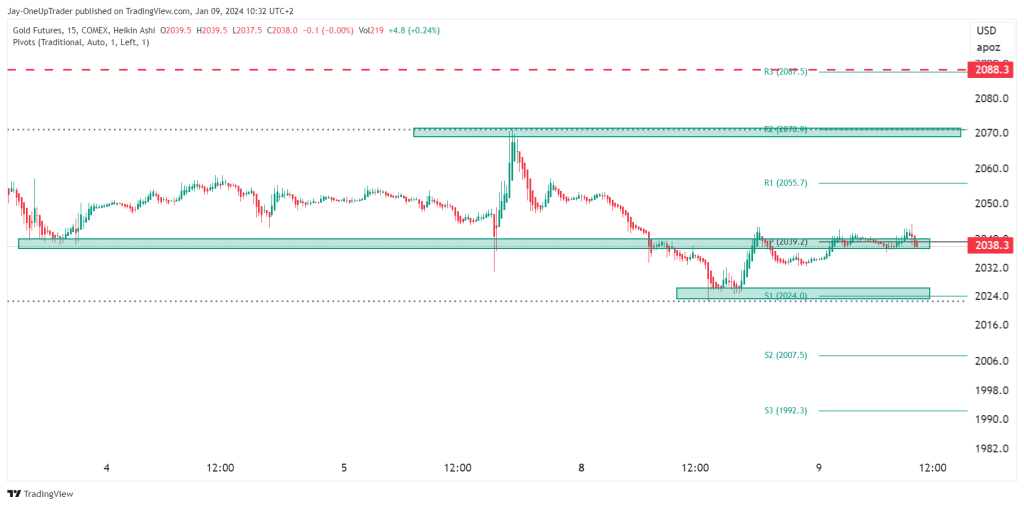
15-minute technicals
Drilling down to the 15-minute chart, we see a consolidation taking shape around the Pivot Point at $2039.20. Nearby resistance sits at $2055.70 (R1) while support rests at $2024.00 (S1). A break above R1 could provide a short-term long trigger targeting the next upside levels at R2 and R3. Conversely, a break below S1 could signal a short setup with S2 and S3 as downside objectives.
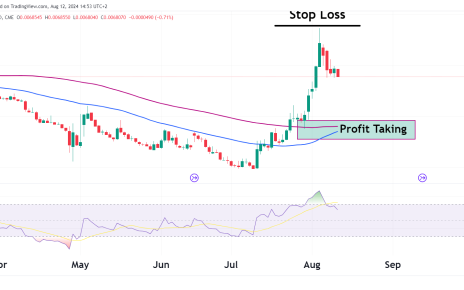
Strategically, a weekly close clearly above Triple Top resistance could provide a bullish entry with stops under that breakout point. To trade bearishly, we want to see a failed test of resistance and subsequent breakdown below the key SMAs. Initial stops could be placed above the Triple Top peaks. Carefully calculating risk relative to potential reward is essential.
In summary, Gold Futures highlight important technical levels on the weekly, daily and 15-minute timeframes. Price action and momentum signals should continue guiding next strategic decisions. Maintaining flexibility and managing risk will allow us to adjust positioning as the market behavior evolves.