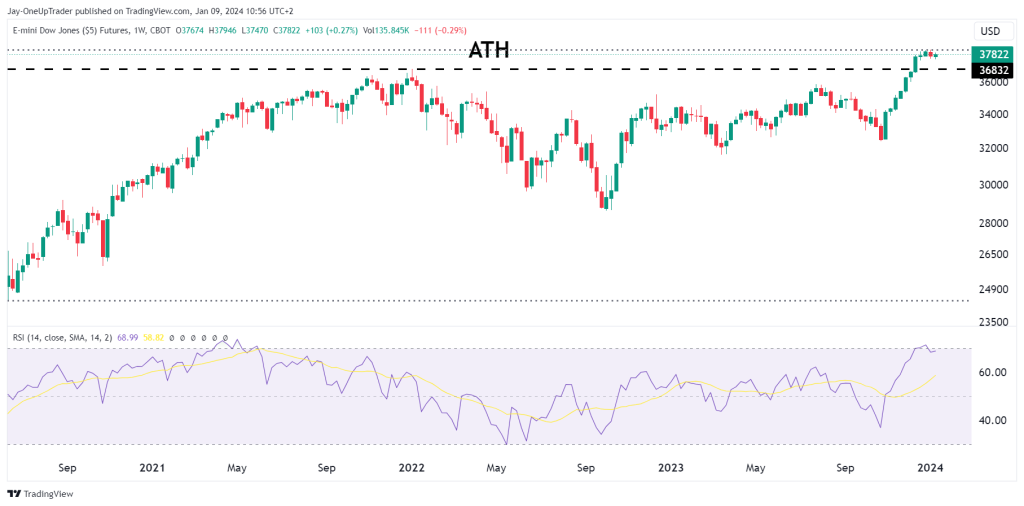
Taking a top-down approach, the weekly time frame shows price exhibiting strong bullish momentum as it rapidly approaches the new all-time highs around 37822 after the previous was broken. The weekly RSI reads 58.82, reflecting neither overbought nor oversold conditions yet and indicating additional room likely remains for this uptrend to continue before exhaustion risk builds. A decisive weekly close above 37822 would signal a bullish breakout and trend continuation.
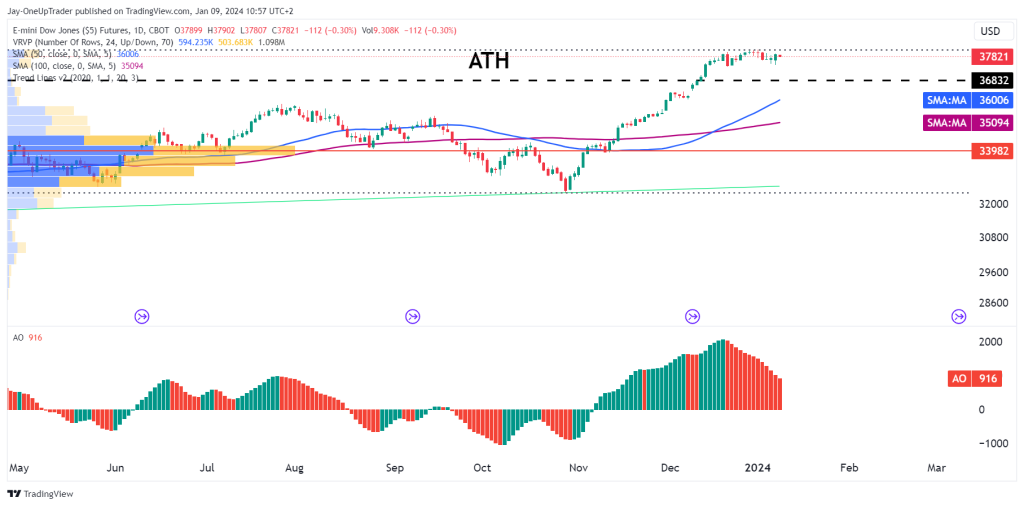
Drilling down to the daily, price trades firmly above its rising 50-day simple moving average at 36006 and 100-day SMA at 35094. These ascending moving averages offer solid dynamic support – a retest of them could provide low-risk long entry opportunities, with protective stops placed below the 100-day.
The volume profile reveals a prominent shelf around 33982 that marks critical support on any test lower, should bearish momentum emerge. This would be a big drop for YM though and would likely need a economic or fundamental reason for that to occur.
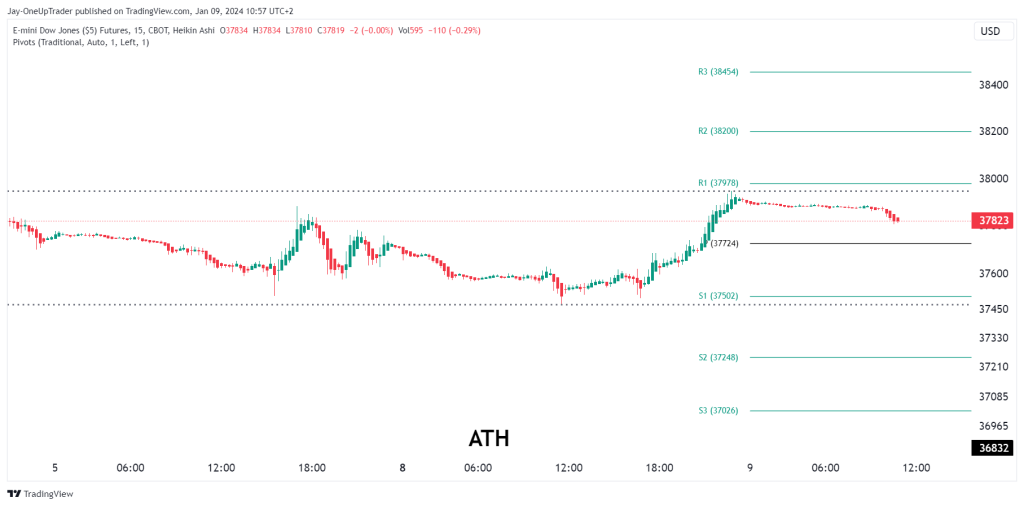
Finally, the 15-minute time frame shows price hovering just below initial resistance at 37978 (R1). A decisive break above R1 could trigger short-term longs targeting the next resistances at 38200 (R2) and 38454 (R3).