

Reading time: 4 min
Introduction
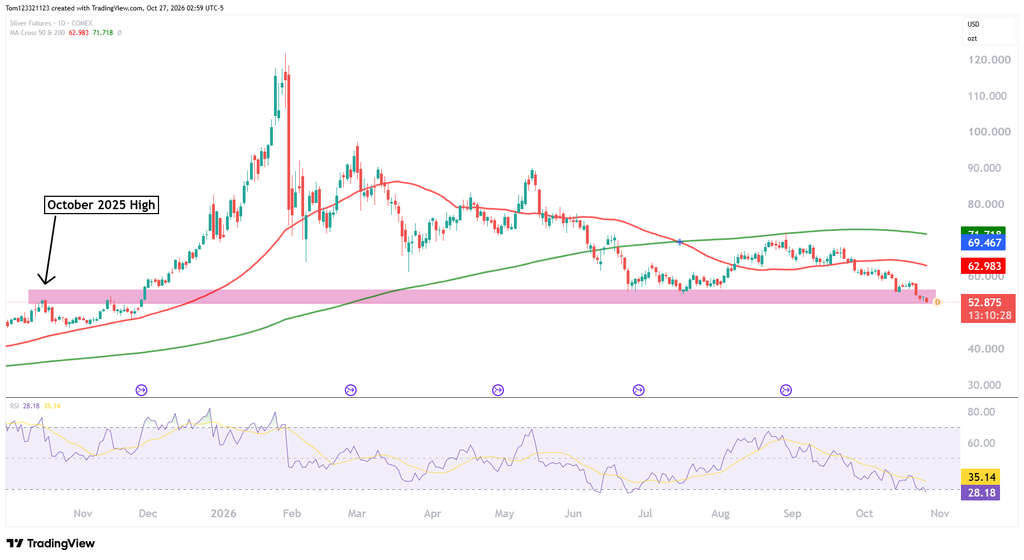
Silver futures are trading near $52.86, testing the lower edge of the $53–$56 support zone after another leg lower. We could say that the price has already broken lower depending on how you draw the support zone. Silver has already dropped below the 2025 October low, and bulls who were hoping for this level to hold are in trouble now as the selling accelerates.
In our October 8 analysis, we were watching whether buyers could defend $56–$58, which they haven’t been able to do.
Silver futures at a glance
- Silver futures are near $52.86, testing the bottom of the $53–$56 support zone.
- The trend is still down. The 50-day average has been below the 200-day since mid-July.
- Bullish case: price gets back above $53 and makes a higher low. Upside levels are $56–$58, then $60–$63.
- Bearish case: a daily close below $53 and a failed retest. Downside levels are $50, then $46–$48.
Is silver still in a downtrend?
The August recovery stalled around $70, and the lower highs that followed have gradually brought silver back toward prices last traded in late 2025.
The 50-day moving average is curving downward and has been below the 200-day MA since mid-July so everything is really pushing into a bearish bias here, and for the metals overall. This is because there are expectations of higher rates coming in the futures.
What are the key silver futures levels to watch?
| Price area | Significance |
|---|---|
| $70–$72 | August recovery high and 200-day moving average |
| $60–$63 | Previous consolidation and 50-day moving average |
| $56–$58 | Broken support and an important recovery hurdle |
| Around $53 | Lower edge of the current support zone |
| $50 | Psychological level and earlier trading activity |
| $46–$48 | Late-2025 base and deeper support reference |
Possible Trading Scenarios
What happens if silver support at $53 holds? Buyers would need to reclaim and hold above $53, then establish a higher low. On the hourly chart, a break above the resulting local swing high could provide a recovery signal, with $56 and $58 as the first resistance areas. A sustained move above $58 would improve the case for a recovery toward $60–$63.
What happens if silver breaks below $53? A daily close below $53 followed by a failed retest would strengthen the bearish continuation scenario toward $50. A further loss of $50 would bring $46–$48 into focus. A rebound that forms a clear rejection would provide a reference for managing risk above the rejection high.
Silver remains under pressure, and the next useful signal is how price behaves around $53. Buyers need to turn this support test into a higher low before the chart offers stronger evidence of a recovery.
This analysis is for educational and informational purposes only and does not constitute trading advice or a recommendation to buy or sell any futures contracts. Futures trading involves significant risk and may not be suitable for all investors. Always conduct your own research and consult with a licensed financial professional before making trading decisions.